


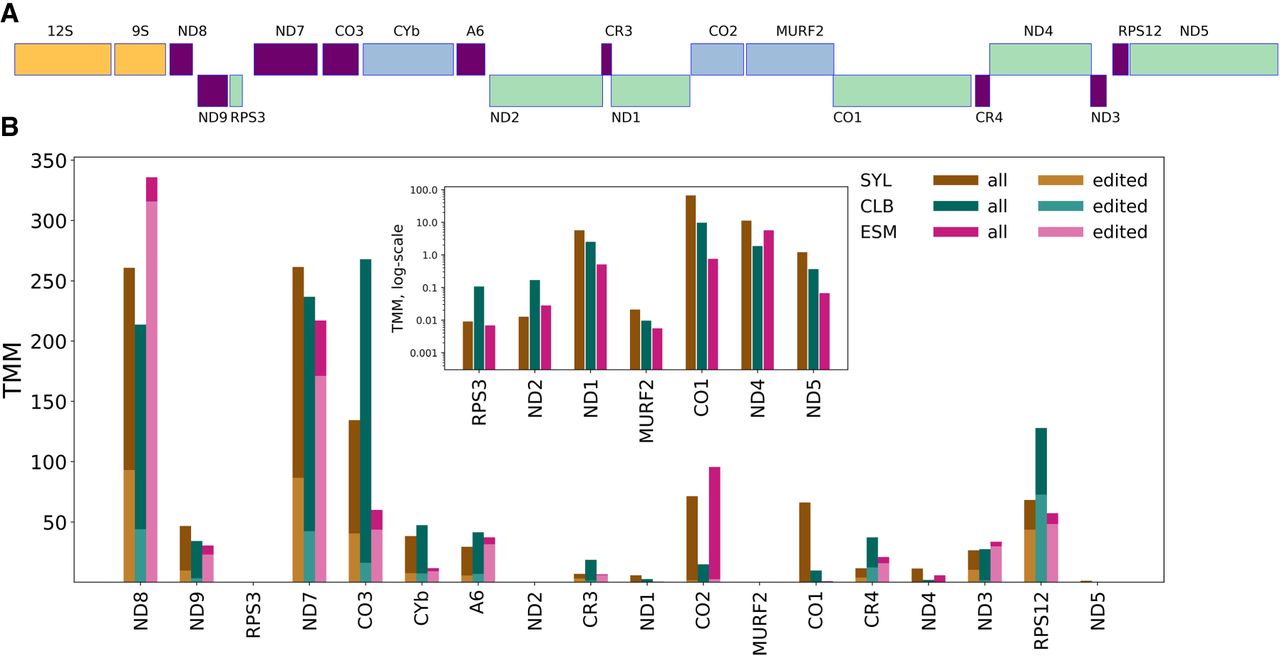
Overall patterns of mitochondrial mRNA abundances show similarity across analyzed strains of Trypanosoma cruzi. (A) Visual representation of the coding region of the T. cruzi maxicircle. The orientation of transcripts is indicated by their position on the top (forward) or bottom (reverse) of the maxicircle coding region depiction. rRNA loci are presented in yellow. Loci that correctly encoded their products are indicated in green, loci producing transcripts requiring only a small domain of RNA editing are shown in blue, and those that produce transcripts requiring editing throughout most of its length are shown in violet. (B) Mitochondrial mRNA abundances derived from total reads or reads containing at least three editing events. The transcripts that are edited are ND8, ND9, ND7, CO3, CYb, A6, MURF2, CR3, CO2, CR4, ND3, and RPS12. Mitochondrial transcripts are ordered from left to right by the order at which they appear on the maxicircle, regardless of orientation. The inset shows all never-edited transcripts and low-abundant MURF2 on a log-scale Y-axis. The low proportions of reads containing editing events aligning to transcripts in the inset (Table 1) are hidden. SYL, strain Sylvio X/10. CLB, strain CL Brener. ESM, strain Esmeraldo.




