


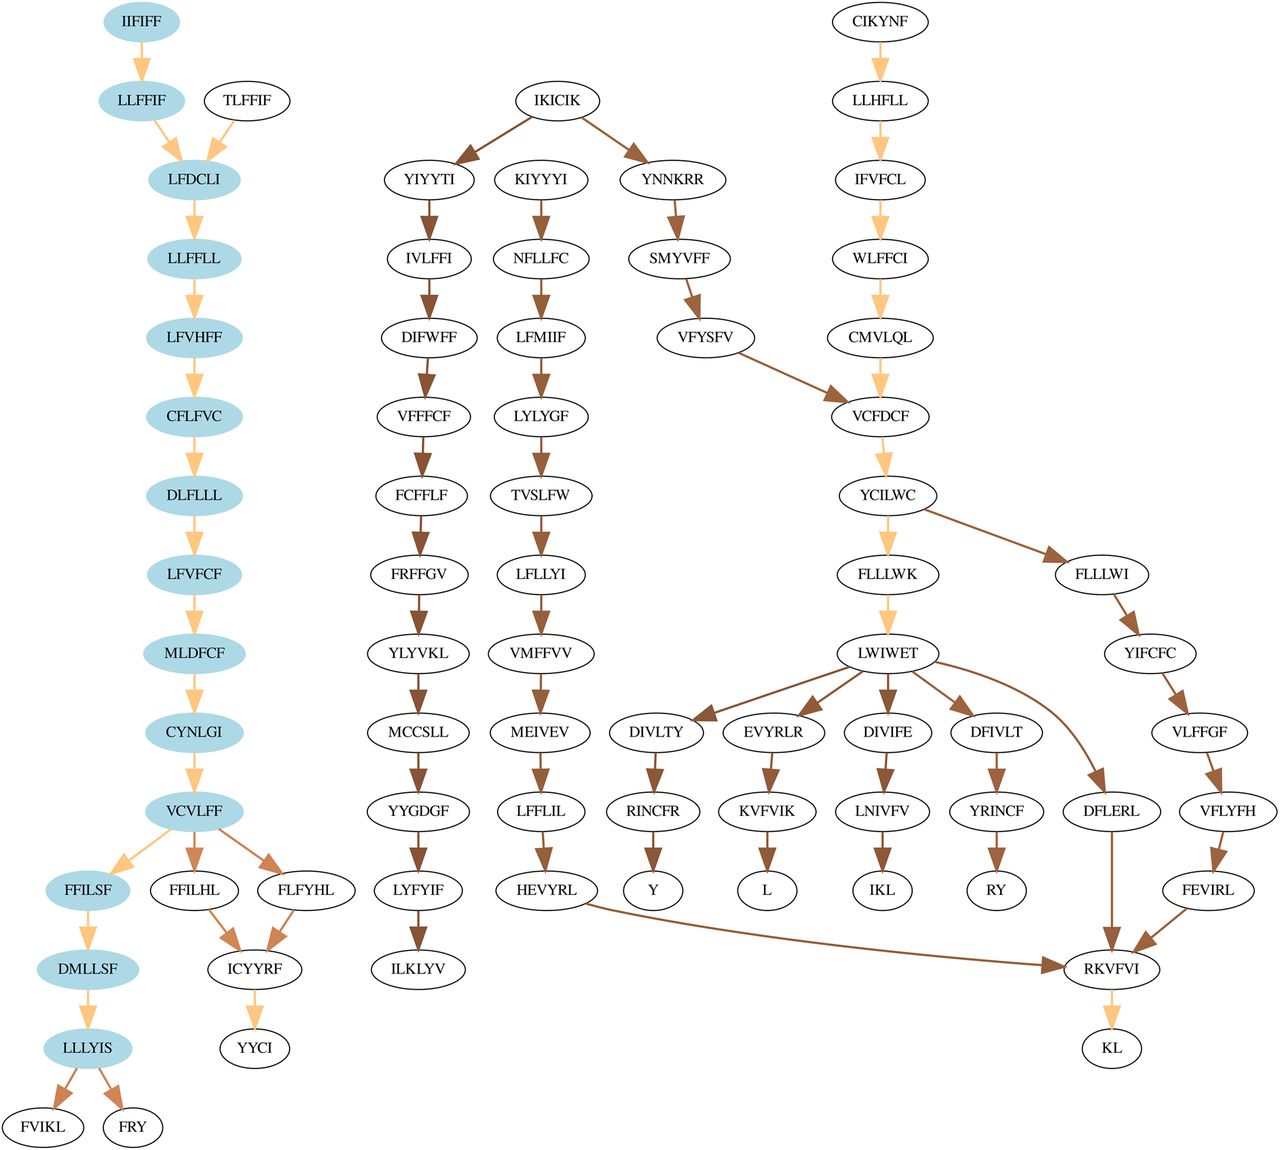
T-Aligner reconstructions of Trypanosoma cruzi edited CR3 reads. Coding capacity graph for strain Sylvio X/10 CR3 based on T-Aligner reconstructions with Illumina sequencing reads. T-Aligner translated ORFs over 78 amino acids long were separated into consecutive series of amino acid 6-mers. The coding capacity is presented as arrows connecting the successive amino acid 6-mer nodes that, when traced, represent the product of an ORF reconstructed by the program. The amino acid pattern colored in blue depicts the longest ORF generated by the T-Aligner (thus, chosen as the “canonical” peptide). Arrow intensities reflect cumulative read support based on the median read support for the entire translated ORFs. Light color: highest read support. Dark color: lowest read support.




