


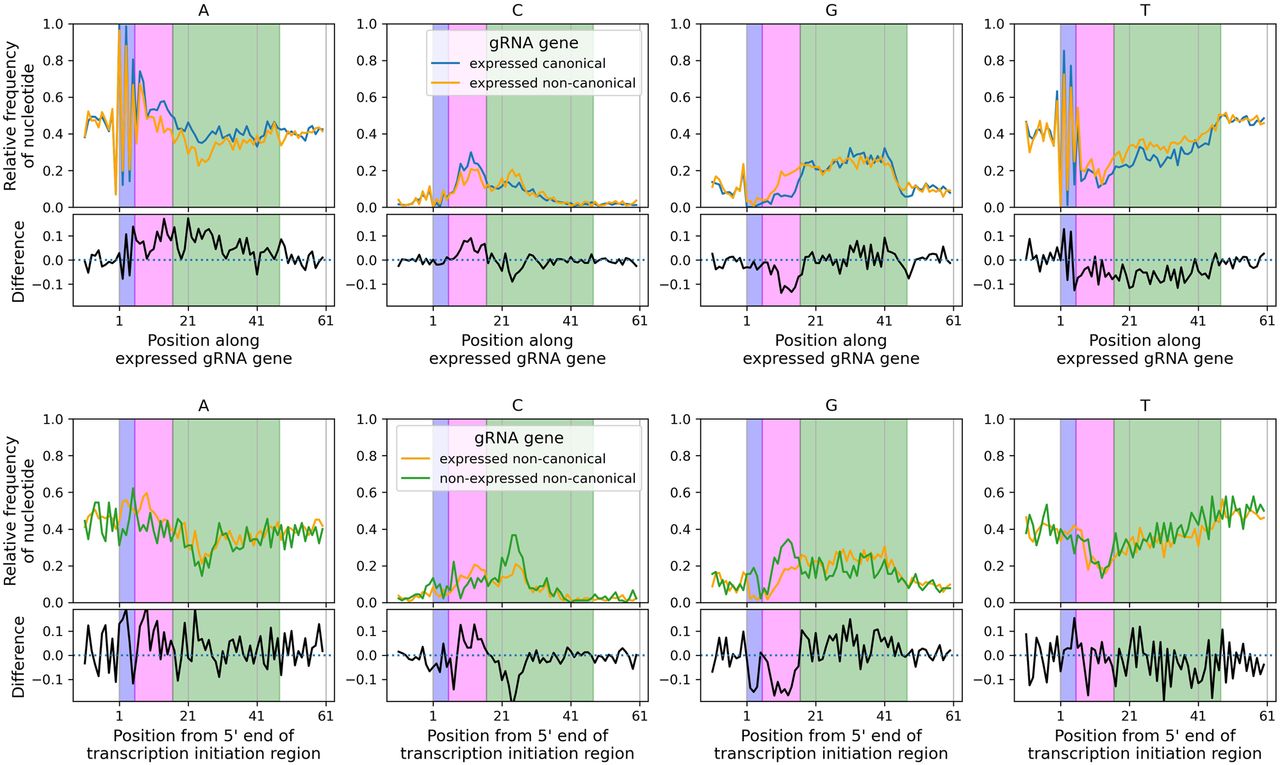
Nucleotide frequency structure of gRNA genes. (Top panels) Expressed canonical (blue lines) and expressed noncanonical (orange lines) gRNA gene sequences were aligned from 10 nt upstream of their 5 nt transcription initiation sequences (the first base of which is at position 1 on the x-axes) and the relative frequency of each nucleotide at each position was obtained. This reveals the ATATA initiation sequence (positions 1 to 5 highlighted by the light blue rectangle), the low-GT/high-AC region from positions 6 to 16 corresponding to the anchor region (light magenta rectangle, see Fig. 5), and the elevated G nucleotide frequency from positions 17 to 47 corresponding to the guiding region (light green rectangle). (Bottom panels) Nonexpressed noncanonical (green lines) and expressed noncanonical (orange lines) gRNA gene sequences were aligned from 10 nt upstream of the initiation region as nonexpressed genes do not have an initiation sequence. Subpanels with black lines show the differences in relative frequencies between expressed canonical and noncanonical genes (upper panels) and between expressed and nonexpressed noncanonical genes (lower panels).




