


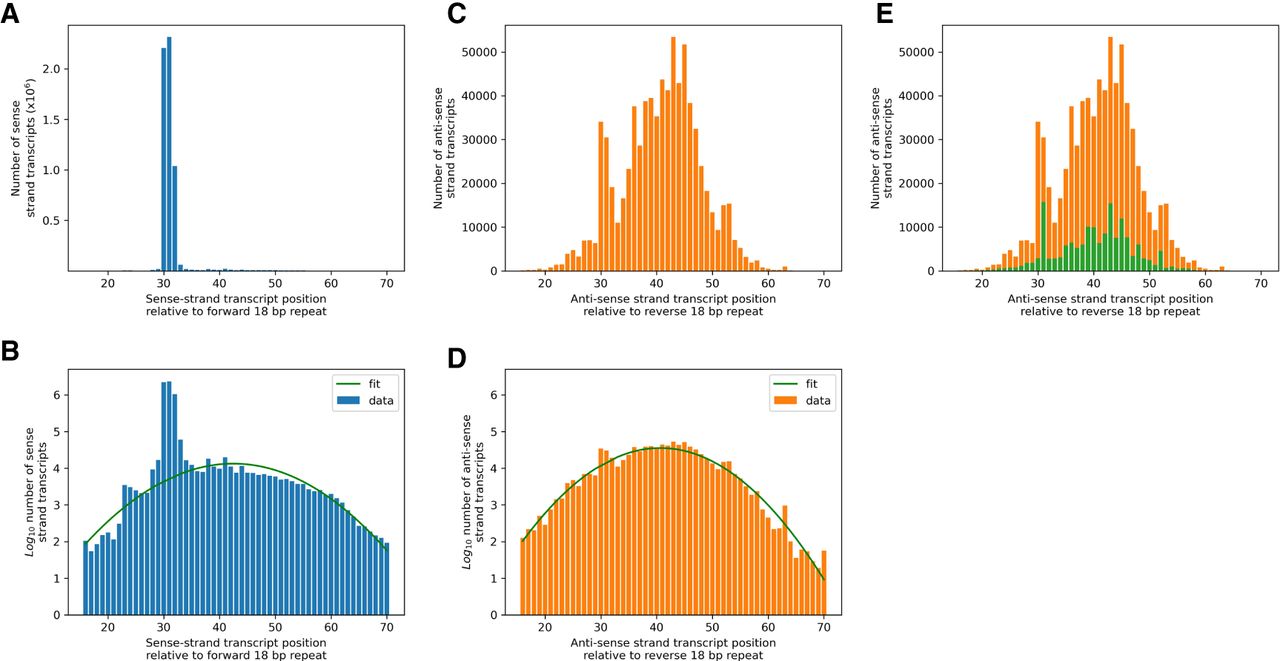
(A) Distribution of positions of mapped 5′ templated ends of all cassette-associated sense strand transcripts relative to the upstream 3′ end of the forward 18 bp repeat. Ninety-four percent of transcripts map to positions 30–32 nt. (B) As 11A but plotting log10 frequency on y-axis to reveal the low-level background distribution of transcript 5′ ends. (C,D), same as for A and B but for antisense strand transcripts relative to the downstream 5′ end of the reverse 18 bp repeat. Eleven percent of antisense transcripts map to positions 30–32 nt. These are mostly associated with the few antisense encoded canonical gRNA genes (E, orange bars: antisense transcripts of antisense canonical gRNA genes, green bars: all other antisense transcripts). The background distribution of sense strand transcripts is approximately normally distributed with mean 42.3 nt and standard deviation 8.5 nt (green line; the normal curve is transformed to a quadratic under log-frequency). Similarly, the background distribution of antisense strand transcripts is approximately normally distributed with mean 40.6 nt and standard deviation 7.3 nt (green line). The non-normal tails of the distributions have been trimmed.




