


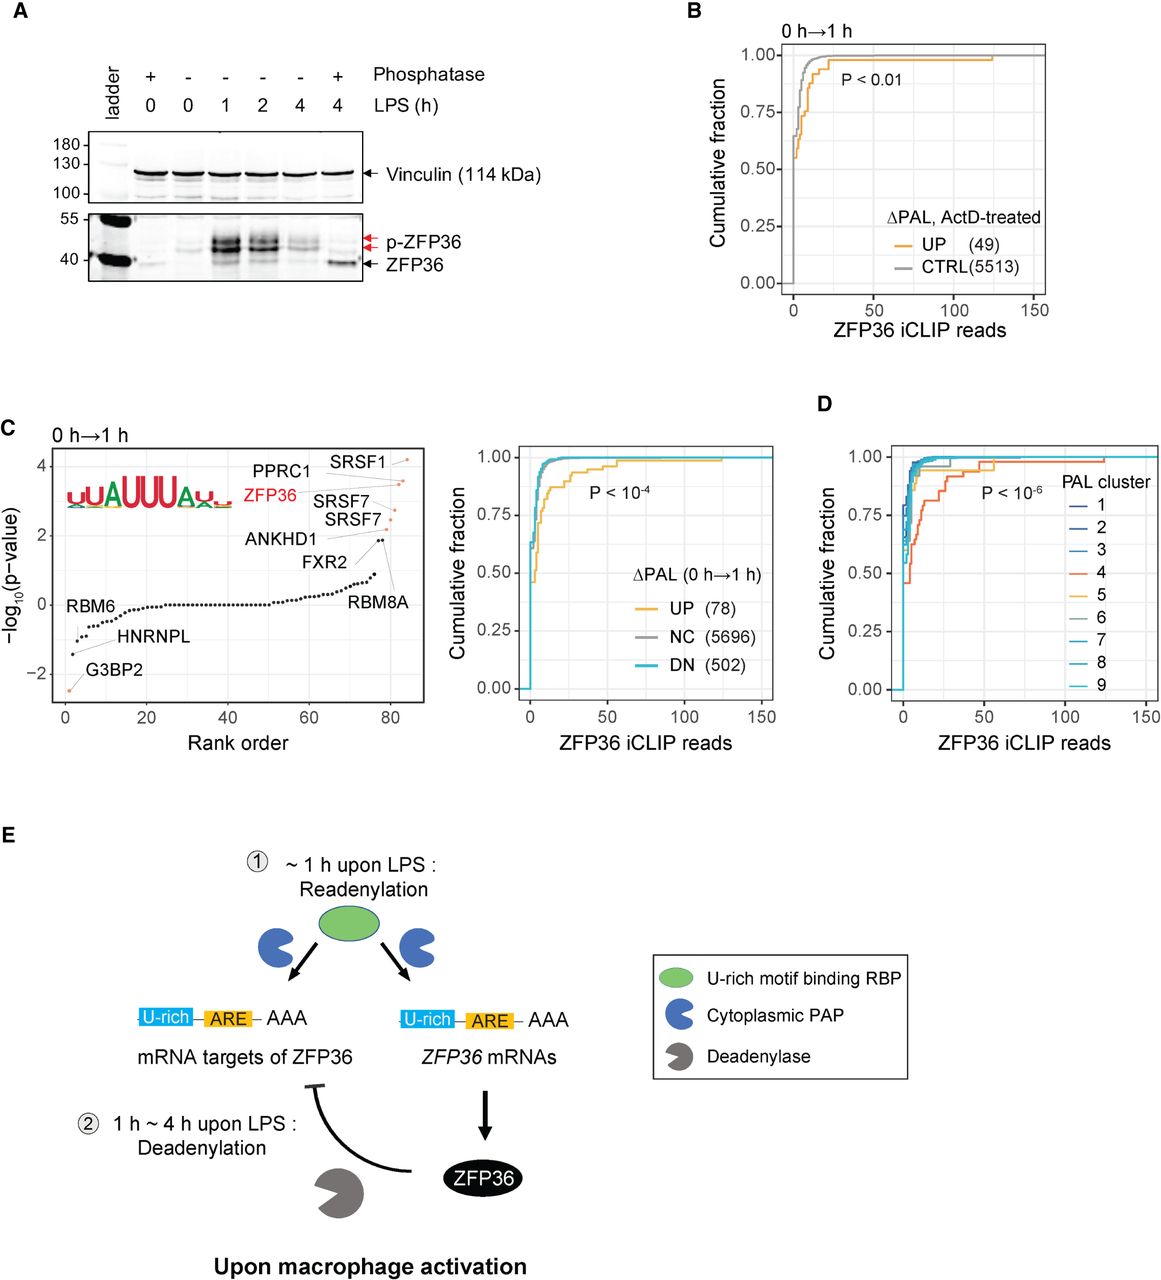
Concomitant readenylation of ZFP36 and its target mRNAs upon macrophage activation. (A) LPS-induced changes in overall protein expression and phosphorylation level for ZFP36 protein was measured by western blot, together with staining for Vinculin as a loading control. One of three replicates is displayed as a representative. (B) CDF of ZFP36 iCLIP binding (x-axis) in the 3′ UTRs of readenylated and control transcripts. The number of transcripts in each group is displayed in the legend. K–S test P-value between UP and CTRL groups is denoted. (C) Association of RBP motifs with ΔPAL (0 to 1 h). (Left) Motif enrichment P-values (Fisher's exact test) in the last 500 nt of 3′ UTRs of transcripts with increased PAL compared to decreased PAL. (Right) CDF of ZFP36 iCLIP binding (x-axis) in the 3′ UTRs of transcripts grouped by PAL changes (DN, NC, and UP). Indicated P-value denotes K–S test P-value between ΔPAL UP and DN groups. The number of transcripts in each group is labeled in the legend. (D) ZFP36 binding across PAL clusters defined in Figure 2D. CDF of ZFP36 binding (x-axis) in 3′ UTRs of transcripts in different PAL-clusters. Wilcoxon test P-values between cluster 4 and the rest of clusters indicated. In B–D, ZFP36 iCLIP data from bone marrow derived macrophage (BMDM) post-activation was used. (E) Model of post-transcriptional feedback loop via ZFP36 mRNA readenylation during macrophage activation. See also Supplemental Figure S7.




