


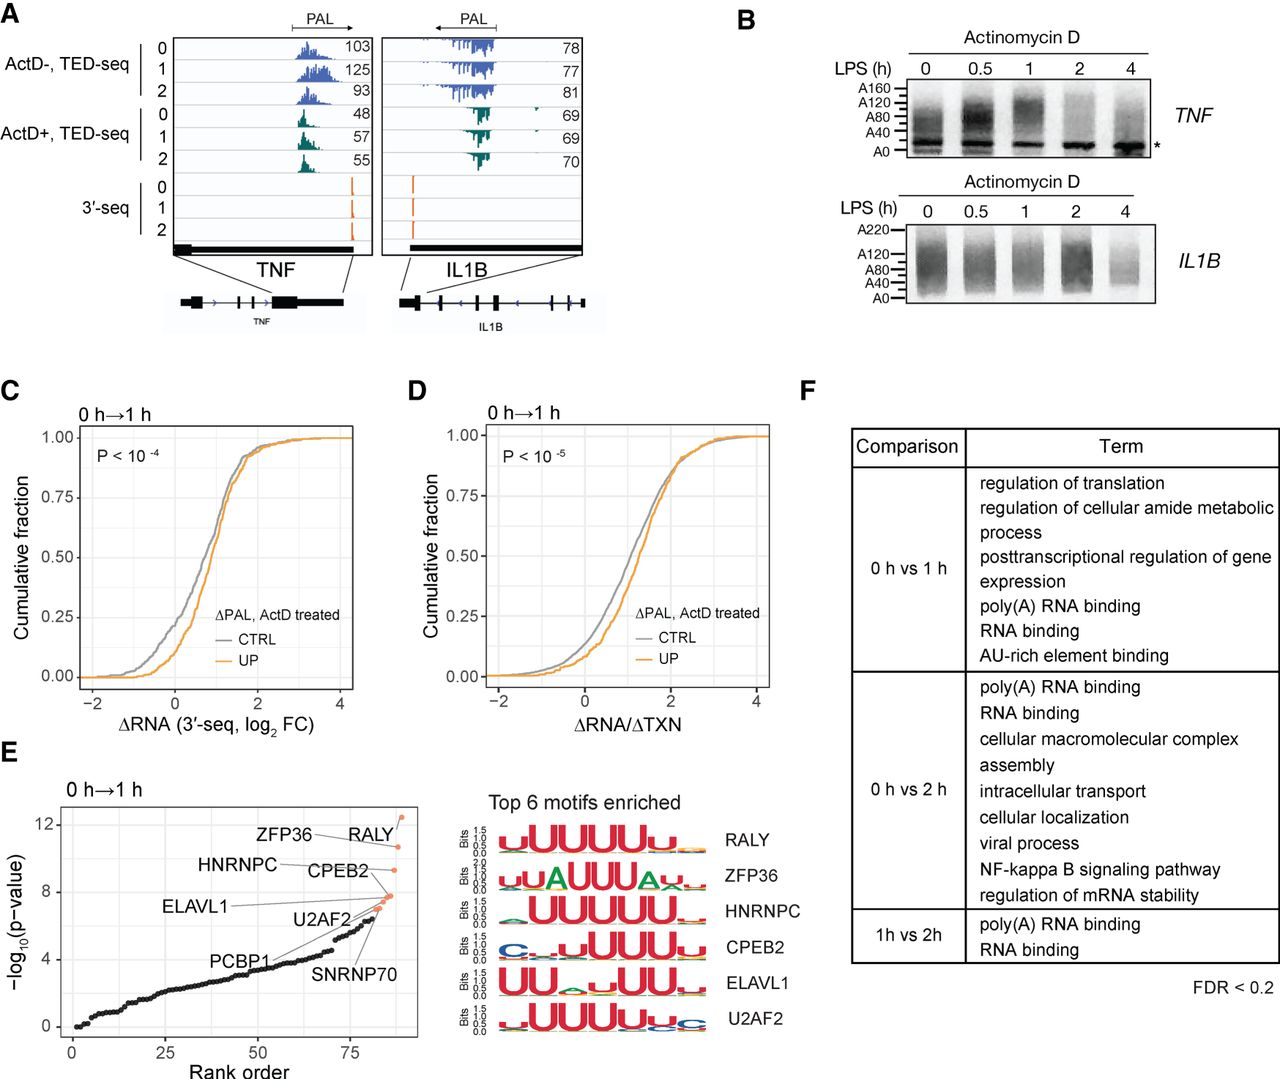
Widespread readenylation during macrophage activation. (A) Genome browser tracks of TED-seq reads for TNF in the presence or absence of Actinomycin D (ActD) at different time-points post-activation (y-axis), together with 3′-seq (ActD-untreated) at the same time-points. Mean PAL is displayed at the corners of TED-seq tracks. 3′-seq peak indicates the position of PAS for the given gene. One of two biological replicates is shown on a genome browser for TED-seq and 3′-seq. (B) PAT assay (tail length, y-axis) for IL1B and TNF, during LPS activation time-course in the presence of ActD. (*) denotes nonspecific band. (C) CDF of ΔRNA (x-axis) compared between readenylated (UP) and control (CTRL) transcripts. K–S test P-value for the comparison between UP and CTRL is denoted. (D) CDF of ΔRNA/ΔTXN (x-axis) for readenylated and control transcripts defined as in C (orange and gray lines, respectively). K–S test P-value for the comparison between UP and CTRL is denoted. (E) Association of RBP motifs with readenylated transcripts. (Left) Statistical significance (y-axis) of RBP motifs tested for enrichment within the 3′-terminal 500 nt of 3′ UTRs of readenylated transcripts compared to control transcripts. (Right) Sequence logos of top ranked motifs. (F) Gene ontology terms enriched in transcripts undergoing readenylation (Fisher's exact test, FDR < 0.2). See also Supplemental Figures S6 and S7.




