


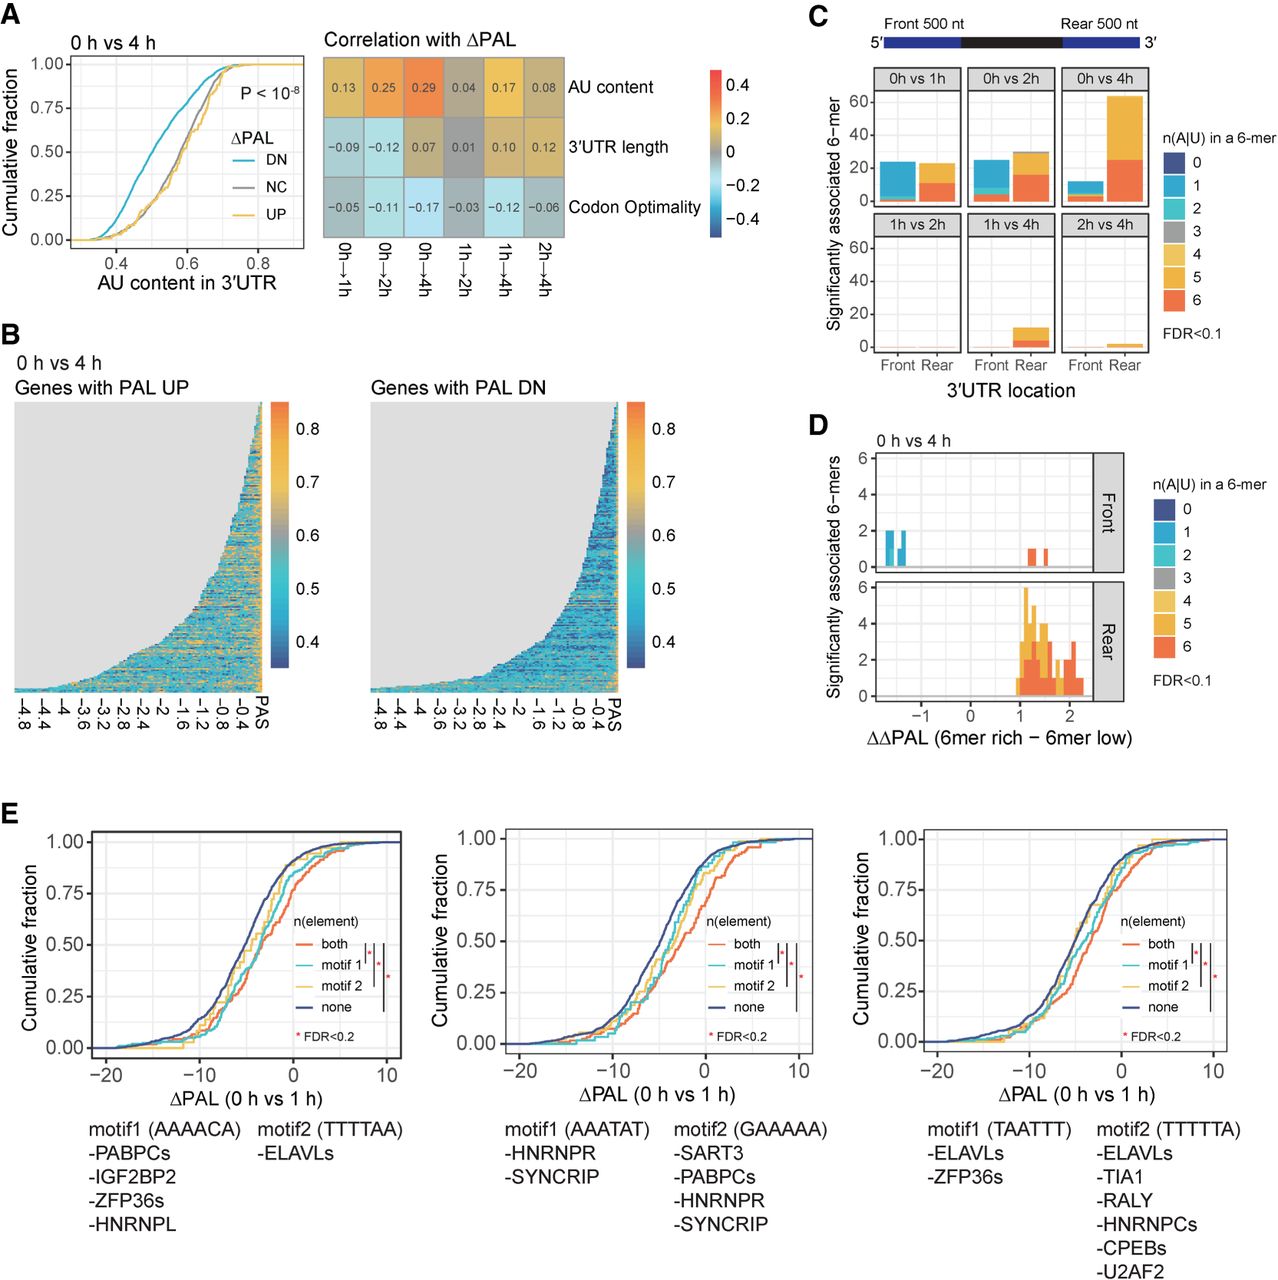
RNA features contributing to PAL control during the macrophage immune response. (A) Association of different transcript features with ΔPAL. (Left) CDF of 3′-UTR AU content (x-axis) in transcripts grouped by ΔPAL between 0 and 4 h (down, DN; no change, NC; up, UP). Indicated P-value denotes two-tailed K–S tests between ΔPAL UP and DN groups. (Right) Heatmap of Pearson correlation coefficients between transcript features (y-axis), and ΔPAL at indicated time intervals (x-axis). When calculating ΔPAL, average value of mean PALs from two biological replicates was compared between two different time points (e.g., PAL4 h–PAL0 h). (B) Heatmap of AU content across 3′ UTRs in transcripts with increased and decreased PAL (left and right panels, respectively). Rows are transcripts ordered by 3′-UTR lengths, and columns (x-axis) are consecutive nonoverlapping 50 nt windows of 3′ UTR for a given transcript isoform, aligned to the PAS. Each cell contains AU content calculated in a given window, where the value is colored from blue to orange (low to high). (C) Association between 3′-UTR motif location and ΔPAL during activation. Number of unique 6-mers associated (Student's t-test, FDR < 0.1) with ΔPAL (y-axis), partitioned by location (first and last 500 nt of 3′ UTR; x-axis), in six time intervals (subpanels). Six-mers grouped and color-coded by number of A or U bases [n(A|U)]. (D) Distribution of ΔΔPAL of the unique 6-mers identified in C, with respect to 3′-UTR locations. The comparison of 0 and 4 h is shown as a representative. Top and bottom subpanels indicate front and rear 3′-UTR positions, respectively. ΔΔPAL (x-axis) is the difference of ΔPAL (0 to 4 h) values between the highest quartile isoforms with a given 6-mer and the lowest quartile isoforms with the 6-mer. 6-mers color-coded as in C. (E) Pairs of 6-mers showing stronger association with ΔPAL (0 h vs. 1 h) in combination than individually (K–S test, FDR < 0.1). The 6-mers identified as associated with ΔPAL (0 h vs. 1 h) in the last 500 nt 3′-UTR windows were tested for their combinatorial effects. The top combinatorial 6-mers are shown as a representative and the other pairs of 6-mers for other time point comparisons are provided in Supplemental Table S6. See also Supplemental Figure S3.




