


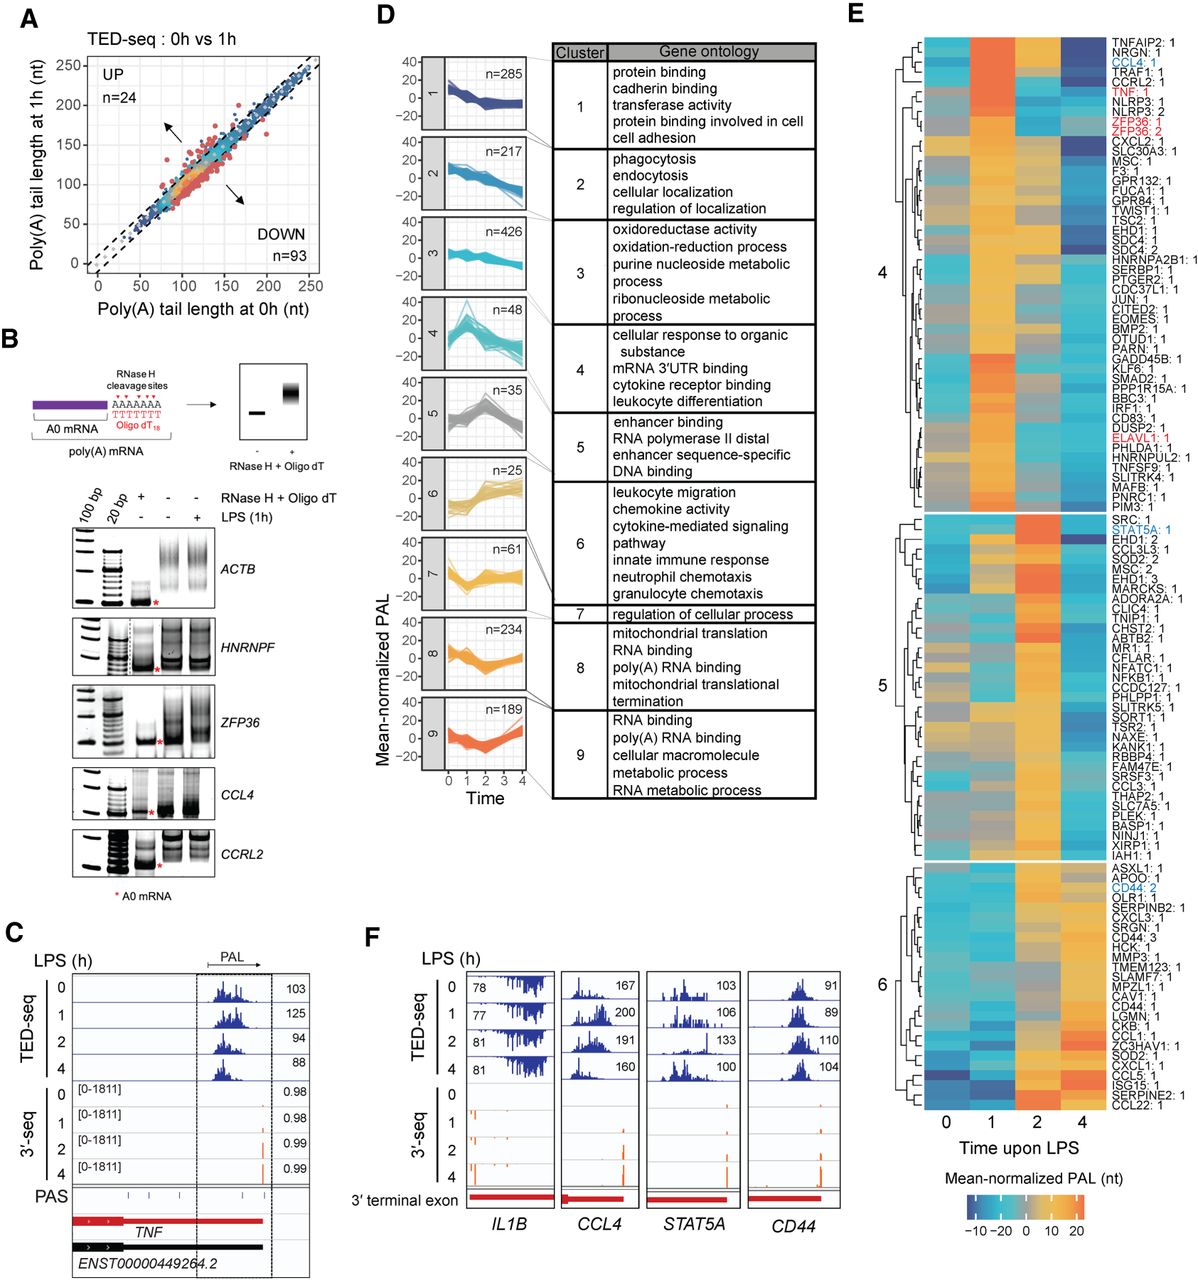
PAL dynamics during macrophage activation. (A) Scatterplot of PALs between 0 (x-axis) and 1 h post-activation (y-axis), averaged from two biological replicates. Each point denotes an isoform identified by 3′-seq. Point density color-coded from blue to orange (low to high). Red points indicate isoforms with significant changes (|ΔPAL| ≥ 10 nt and K–S test FDR < 0.1 in both replicates). (B) Validation of TED-seq results by PAT assay for indicated genes. Final PAT-PCR products were analyzed on 6% nondenaturing polyacrylamide-TBE gel, followed by SYBR Gold staining. Deadenylated form (A0 mRNA; asterisk) was generated by treating total RNA with RNase H and Oligo dT. (C) Genome browser tracks of TNF: TED-seq profiles and mean PAL (top 4), 3′-seq profiles and percentage of PAS isoform (PPI; next 4), during time-course. Values in square brackets indicate read count (y-axis) range. De novo PAS isoforms track (PAS) is displayed on the ninth lane. For D and E, mean poly(A) tail lengths from two biological replicates were averaged for a given transcript isoform. The averaged PAL at each time point was mean-normalized by subtracting mean of the averaged PALs across all time points. The resulting mean-normalized PAL values were plotted. (D) Distinct poly(A) tail length changing patterns during macrophage activation. GO terms enriched (Fisher's exact test, FDR < 0.2) in genes of each PAL-changing pattern listed. (E) Heatmap of mean-normalized PALs in clusters 4, 5, and 6; labels identify genes and isoform index. (F) Genome browser tracks of genes from clusters 4, 5, and 6 (colored in blue in E, x-axis) and IL1B as a negative control with no PAL change. One of two biological replicates is shown for TED-seq and 3′-seq data as a representative on the genome browser for C and F. Mean PAL displayed per track. See also Supplemental Figures S2 and S3.




