


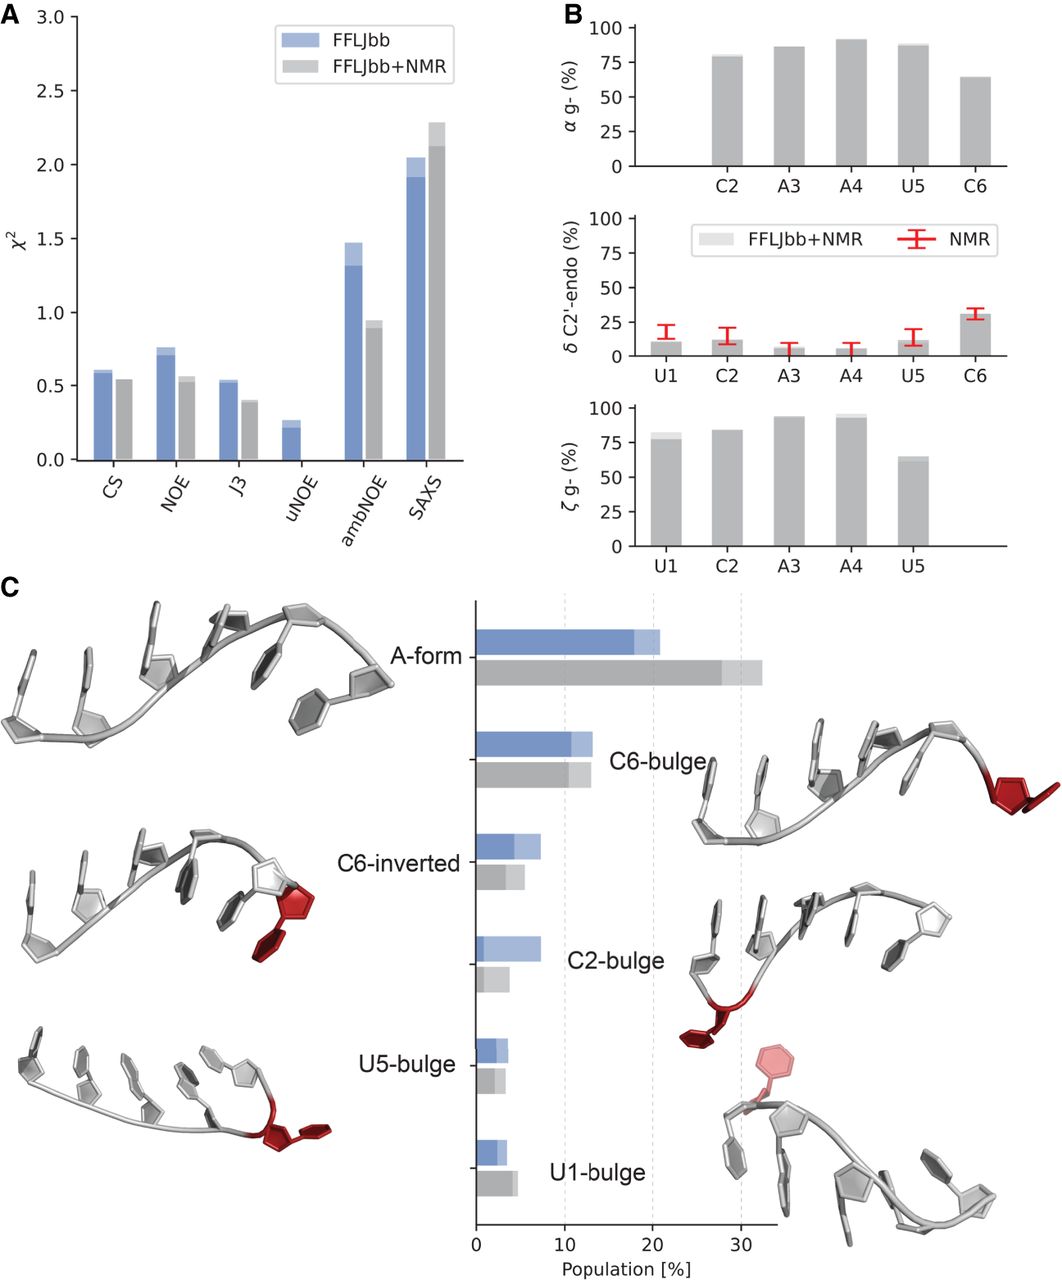
FIGURE 4.
FFLJbb MD ensemble reweighted using NMR data. (A) Agreement with experimental data measured as  before (blue bars) and after reweighting (gray bars). (B) Population of rotameric states for each residue: α gauche−, δ in C2′-endo, and ζ in gauche− conformation, as indicated. (C) Cluster populations before and after NMR reweighting. The two bars in all panels indicate averages calculated over two independent
simulations. Representative three-dimensional structures are shown next to each bar. Nucleotides that deviate from the canonical
A-form conformations are shown in red.
before (blue bars) and after reweighting (gray bars). (B) Population of rotameric states for each residue: α gauche−, δ in C2′-endo, and ζ in gauche− conformation, as indicated. (C) Cluster populations before and after NMR reweighting. The two bars in all panels indicate averages calculated over two independent
simulations. Representative three-dimensional structures are shown next to each bar. Nucleotides that deviate from the canonical
A-form conformations are shown in red.




