


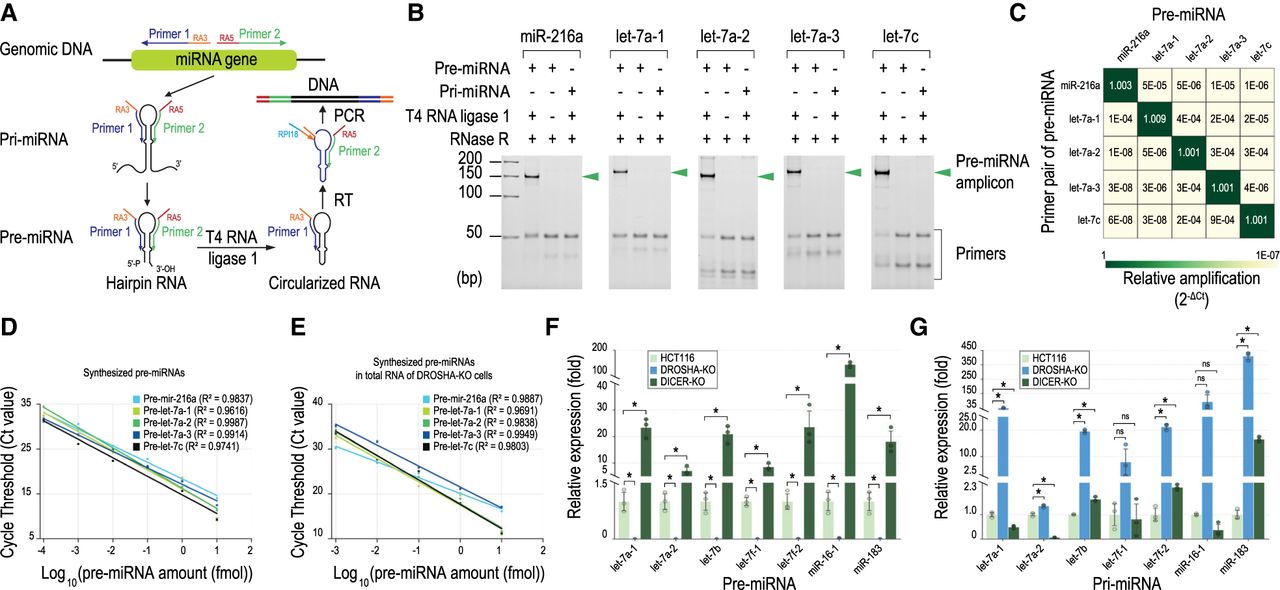
Quantification of pre-miRNAs by iLIME-qPCR. (A) Schematic diagram to illustrate the iLIME-qPCR. Pre-miRNA is first circularized by T4 RNA ligase 1. The circularized pre-miRNA is then reverse-transcribed to generate cDNA spanning the 5′-end and 3′-end of the pre-miRNA. The cDNA is then amplified with a pair of primers using PCR. (B) iLIME-PCR can amplify the circularized pre-miRNAs, but not the original hairpin pre-miRNAs or parental pri-miRNAs. iLIME-PCR was conducted for unligated pre-miRNAs, ligated pre-miRNAs, and their parental pri-miRNAs. (C) iLIME-qPCR specifically amplifies pre-miRNAs. This method was carried out similar to iLIME-PCR in Figure 2B except that SYBR Green I was added to the PCR reaction, the primer set 7 (Supplemental Fig. S2A) was used, and the PCR products were real-time quantified using the Roche LightCycler 480 real-time PCR system. The iLIME-qPCR primers designed for one pre-miRNA were also tested on four other pre-miRNAs. 10 fmol of each pre-miRNA were used in each qPCR reaction. The numbers shown on the heatmap were the average relative amplification values of three iLIME-qPCR repeats. The relative amplification was estimated as 2−ΔCt, such that the ΔCt was the difference between the Ct values obtained from the iLIME-qPCR using the primer set for one pre-miRNA and any of the other pre-miRNAs. (D) iLIME-qPCR can also be conducted on synthesized pre-miRNAs. Different amounts (i.e., from 0.0001 fmol to 10 fmol) of pre-miRNAs were tested. (E) iLIME-qPCR can also quantify synthesized pre-miRNAs added to the total RNAs isolated from DROSHA-KO cells. Different amounts (i.e., from 0.001 fmol to 10 fmol) of pre-miRNAs were tested. (F) iLIME-qPCR can also be used to estimate different expression levels of endogenous pre-miRNAs in HCT116, DROSHA-KO, and DICER-KO cells. Two-tailed two-sample assuming unequal variances t-tests for statistical analysis were used to calculate the P-value. (ns) Not significant, (*) P-value <0.05. (G) qPCR was used to estimate the expression levels of the endogenous parental pri-miRNAs of the pre-miRNAs shown in F. Two-tailed two-sample assuming unequal variances t-tests for statistical analysis were used to calculate the P-value. (ns) Not significant, (*) P-value <0.05. Primer sequences used for pre-miRNA and pri-miRNA quantification are shown in Supplemental Tables S2 and S3, respectively.




