


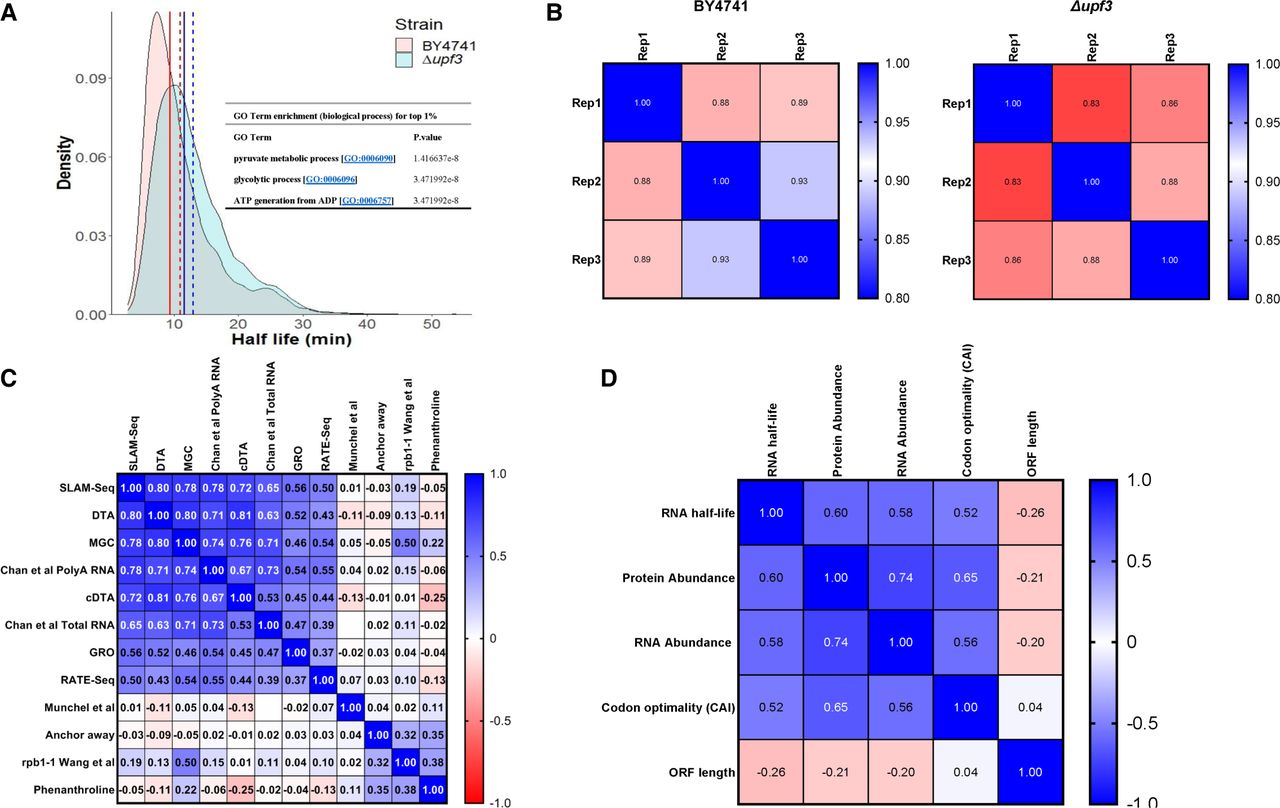
Half-life distribution and comparison to other methods. (A) Half-life distribution in wt and upf3Δ. The dashed line indicates mean and solid line the median; red is for wt and blue for upf3Δ. Partial enrichment analysis for the longest lived 1% of the transcripts is shown as an inset (full GO term enrichment for longest lived 1% is listed in Supplemental Table S6). (B) Inter-replicate correlation using Pearson's correlation coefficient. (C) Comparison of half-lives calculated using SLAM-seq to other methods using Spearman's rho. GRO (Pelechano et al. 2010), cDTA (Sun et al. 2013), DTA (Miller et al. 2011), MGC (Baudrimont et al. 2017), Chan et al. with and without poly(A) selection (Chan et al. 2018), Munchel et al. (2011), RATE-seq (Neymotin et al. 2014), Anchor away (Geisberg et al. 2014), rpb1-1 (Wang et al. 2002), phenanthroline (Grigull et al. 2004). Chan et al. (2018) RNA total and Munchel et al. (2011) were not significantly correlated (P = 0.996), hence the correlation was left blank. (D) Correlation of half-lives to other transcripts features using Spearman's rho. RNA abundance was calculated using the mean CPM across all the time points of wt, protein abundance was from Ho et al. (2018), codon optimality was from Drummond et al. (2006), and ORF length from annotations of S. cerevisiae S288C (assembly R64).




