


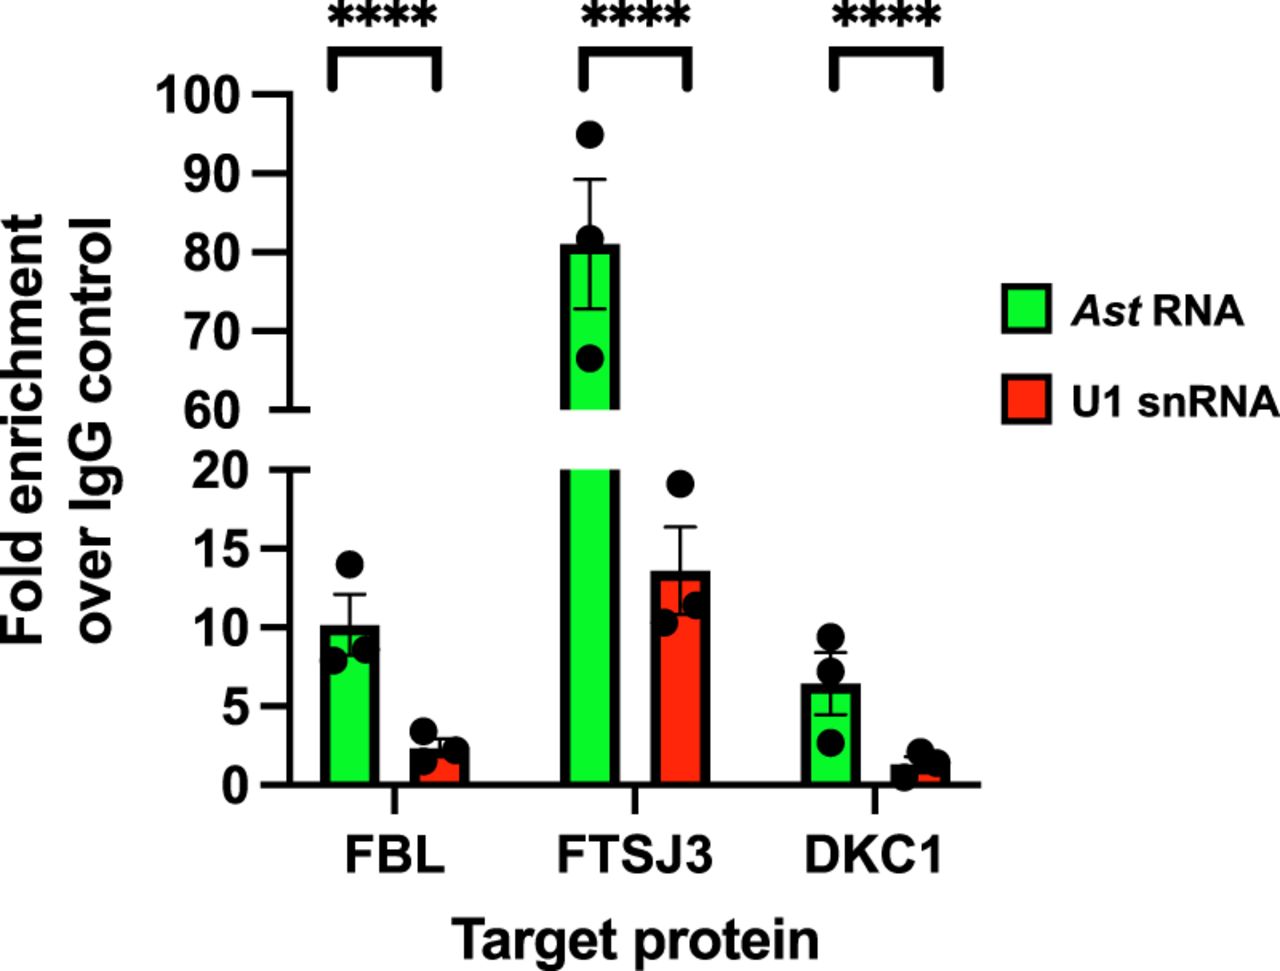
RNA immunoprecipitation (RIP) assay using antibodies directed against the 2′-O-methyltransferases, FBL and FTSJ3, and the pseudouridine synthase 1, DKC1. Whole cell lysates from Jurkat-AST cells were incubated with antibodies to FBL, FTSJ3, DKC1, or preimmune rabbit IgG, and then with Protein-A Dynabeads. Immunocomplexes were washed, and RNA extracted and used in RT-qPCR assays to detect the presence of Ast (green bars) and U1 snRNA (red bars). The data show fold enrichment of Ast or U1 snRNA over the preimmune IgG control levels. Each dot represents an independent immunoprecipitation experiment (three biological replicates for each target protein), and it represents the mean value of three PCR reactions (three technical replicates for each amplification). Bars represent standard error of means (SEM). Statistical analyses were performed by two-way ANOVA (Graph Prism). (****) P < 0.0001.




