


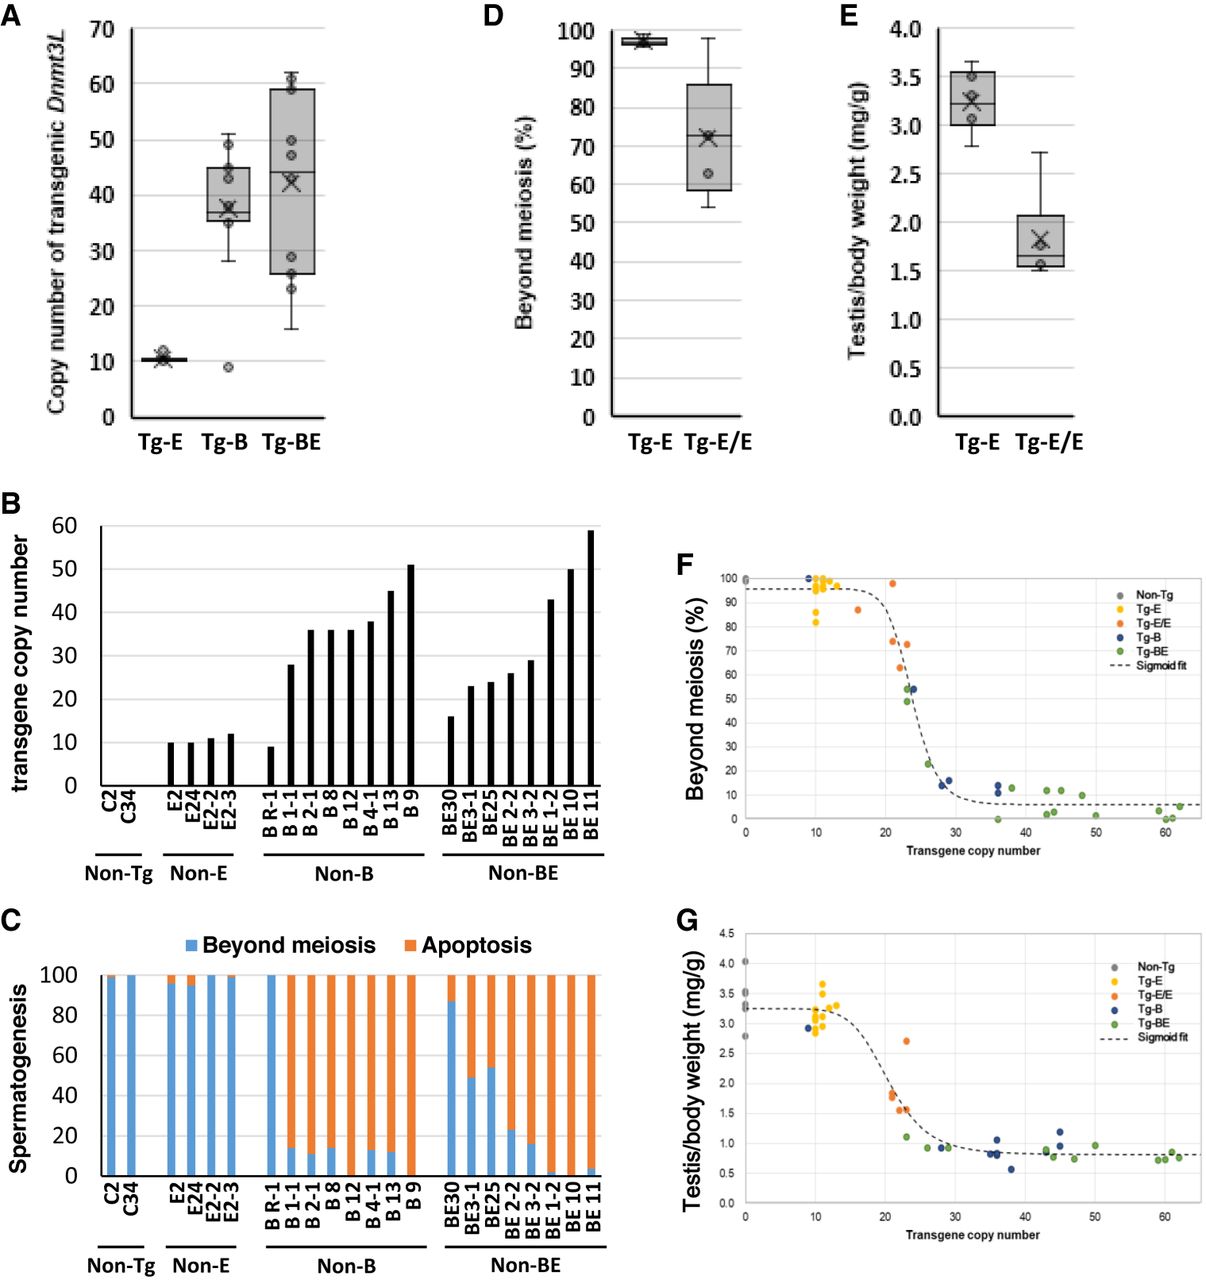
Copy numbers of asDnmt3L transgenes and their correlation with phenotypes. (A) asDnmt3L transgene copy numbers in mice with transgenes inserted at the E1 locus (Tg-E), B3 locus (Tg-B), and B3 and E1 loci (Tg-BE) were confirmed using quantitative polymerase chain reaction. Each dot indicates the copy number. The range of the whisker lines indicates the minimum and maximum values, excluding outliers. The box range indicates the interquartile range (IQR), the horizontal bars in the box indicate the median, and the “X” marks indicate the mean value. (10, 38, and 42 copies in Tg-E, Tg-B, and Tg-BE mice, respectively). (B) Transgene copy numbers represented through a bar graph. (C) Percentage of cells in seminiferous tubules that have undergone meiosis. The blue and red bars represent the cells that have completed meiosis and those that are arrested at meiosis, respectively. (D) Progression of spermatogenesis in mice with single or double alleles of the transgene cassette inserted at the E1 locus (Tg-E and Tg-E/E mice, respectively). Each dot represents the percentage of cells in the tubules of a mouse that have completed meiosis. The range of the whisker lines indicates the minimum and maximum values excluding outliers. The box range indicates the interquartile range (IQR), the horizontal bars in the box indicate the median, and the “X” marks indicate the mean value (97% and 72% in cells with single and double transgenic alleles, respectively). Student's t-test; (*) P < 0.01. (E) Testicular weight relative to the body weight of mice with single or double transgenic alleles. Each dot represents testis weight relative to body weight (mg/g) and horizontal bars represent averages (3.2 and 1.8 mg/g for mice with single and double transgenic alleles, respectively). Student's t-test; (*) P < 0.01. (F,G) Correlation between Dnmt3L copy number and the progression of spermatogenesis (F) or testicular weight relative to body weight (G). Black, yellow, orange, blue, and green dots indicate cells derived from non-Tg mice, Tg-E mice, mice with double transgenic alleles (Tg-E/E), Tg-B mice, and Tg-BE mice, respectively. The fitting curves were adjusted to a sigmoidal model (Min = 6.03, Max = 95.81, half-maximal effective concentration [EC50] = 23.72, R2 = 0.98 for F; and Min = 0.82, Max = 3.25, EC50 = 20.5, R2 = 0.94 for G).




