


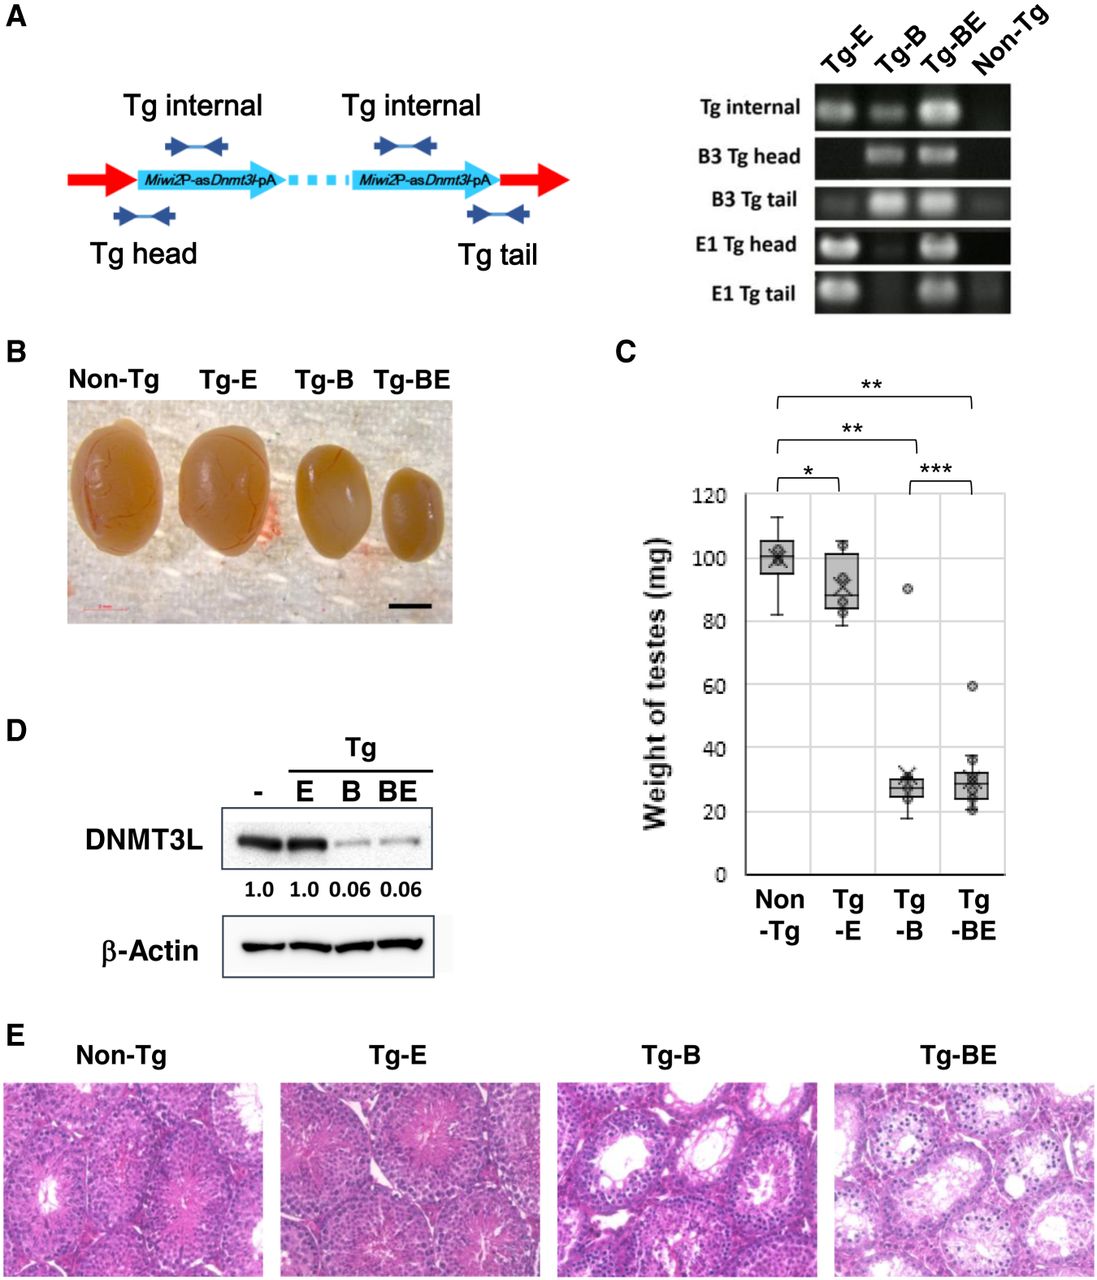
Transgenic mice (Tg) phenotypes. (A) Schematic illustration of polymerase chain reaction (PCR) primer annealing sites to confirm Tg cassette insertion sites. “Tg internal” legends indicate the junctions between Miwi2 promoter and asDnmt3L. “Tg head” shows the junction between genomic DNA and the Miwi2 promoter at Ch18qB3 and E1 sites, and “Tg tail” shows the junction between the tail of the Tg cassette and genomic DNA at each insertion site. The primer sequences are shown in Supplemental Table S4. The PCR products were subjected to agarose gel electrophoresis with Tris-acetate EDTA buffer (right panel). (B) Morphology of testes of adult mice with transgenes inserted at the E1 locus (Tg-E), B3 locus (Tg-B), and B3 and E1 loci (Tg-BE). Black bar indicates a 2 mm scale. (C) Weights of the testes of Tg-E, Tg-B, and Tg-BE mice. Each dot represents the weight of each testis. The range of the whisker lines represents the minimum and maximum values; outliers were excluded. The box ranges indicate the interquartile range (IQR), the horizontal bars in the box indicate the median, and the “X” marks indicate the mean weights. (98.4, 90.8, 32.0, and 29.8 mg in non-Tg, Tg-E, Tg-B, and Tg-BE mice, respectively; t-test; [*] P = 0.15; [**] P < 0.01; [***] P = 0.72). (D) DNMT3L expression in mice testes at E16.5 was analyzed using western blotting. Upper panel shows DNMT3L, and lower panel shows β-actin. Each lane was loaded with protein extracts from one-half of a testis. The band intensity of DNMT3L was normalized to that of β-actin, as well as to that of DNMT3L in non-Tg mice. Analysis was performed using a GelAnalyzer 2010. (E) Hematoxylin and eosin-stained histological sections showing developmental differences between non-Tg, Tg-E, Tg-B, and Tg-BE mouse testes.




