


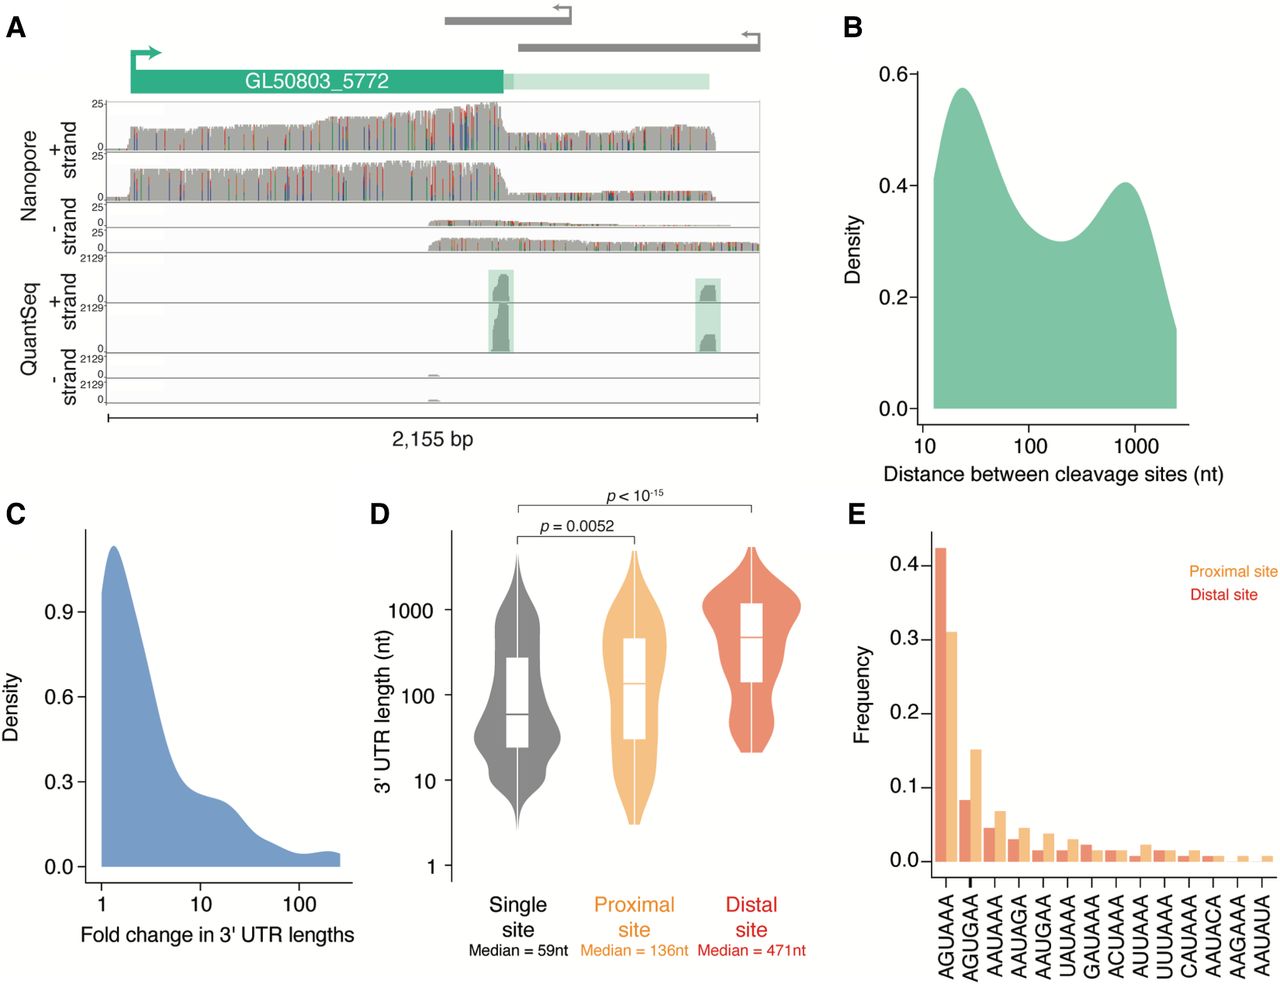
Evidence of alternative polyadenylation in G. lamblia. (A) Genome browser image looking at the 3′ end of GL50803_5772 and displaying coverage of ONT libraries (top) and 3′-end libraries (bottom). Both methods support the presence of two distinct cleavage sites for the gene. (B) Density plot showing the distribution of lengths between proximal and distal cleavage sites for the genes that have more than one cleavage site. The median is 81 nt. (C) Density plot showing the fold change in 3′ UTR length between distal and proximal cleavage sites. Median is a 2.18-fold change. (D) Distribution of 3′ UTR lengths for genes with a single cleavage site (left), the proximal sites for APA genes (middle), and the distal sites (right). (E) Poly(A) signal usage in APA genes. Sequences 30 nt upstream of proximal and distal cleavage sites were used to search for the motifs described in Figure 2B. Plotted is the frequency of each motif across proximal (orange) and distal (red) cleavage sites.




