


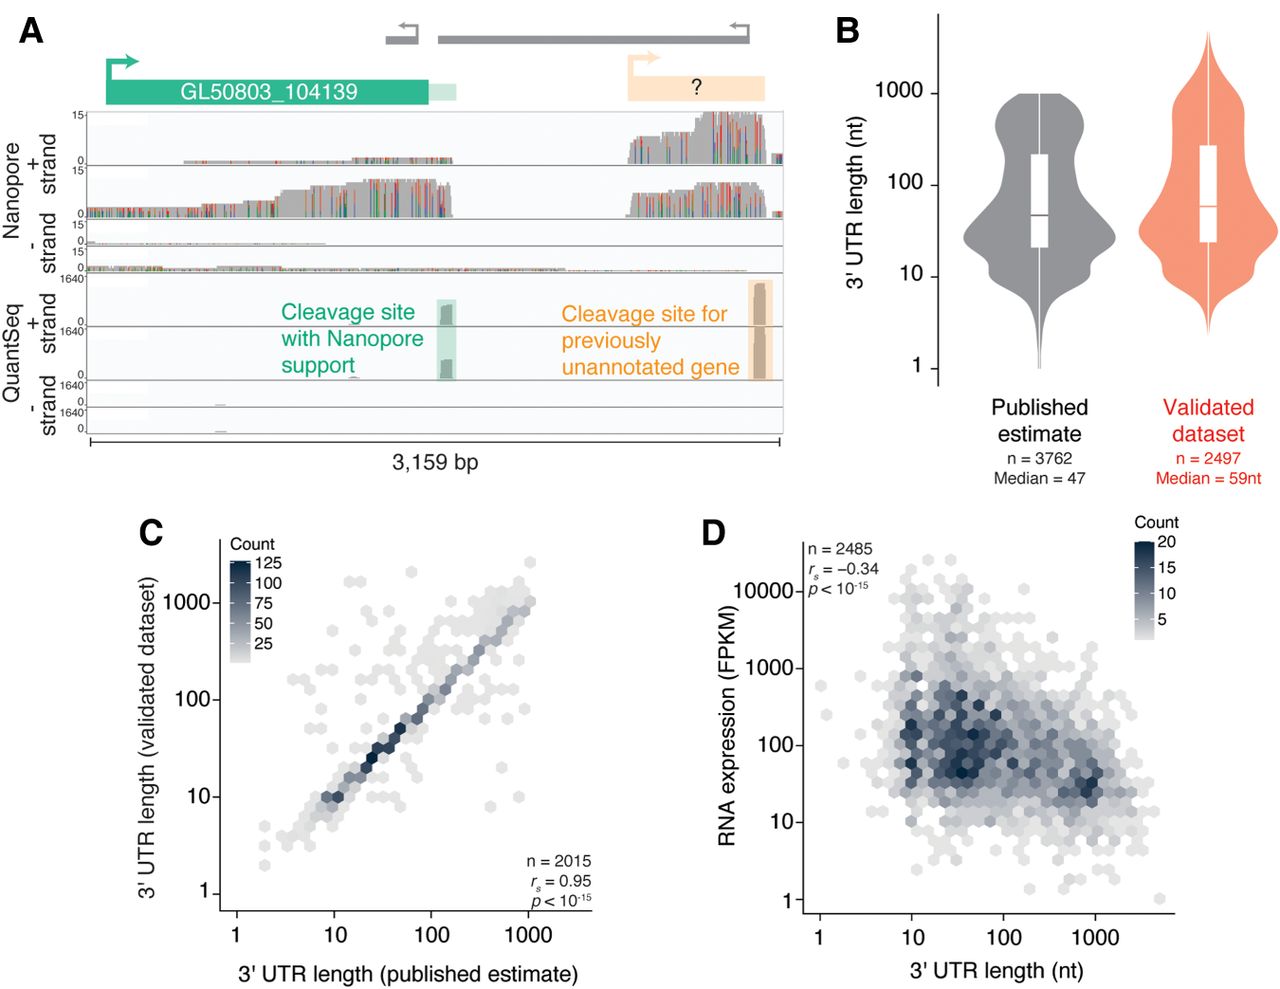
Characterization of G. lamblia 3′ ends at nucleotide resolution. (A) Genome browser image looking at the 3′ end of GL50803_104139 and displaying coverage of ONT libraries (top) and 3′-end libraries (bottom). Of the two cleavage sites predicted by the 3′-end libraries, one is supported by the ONT libraries (green box), while the other appears to belong to a previously unannotated transcript (orange box). (B) Distribution of 3′ UTR lengths in previously published work ((Franzén et al. 2013), left) and this study (right). (C) Hexagonal heatmap comparing published estimates of 3′ UTR lengths (x-axis) and the new data set from this study (y-axis). (D) 3′ UTR length is negatively correlated with expression. Shown is a hexagonal heatmap comparing 3′ UTR length (this study) and mRNA expression in Fragments Per Kilobase of transcript per Million mapped reads (FPKM, from accession number GSE158187).




