


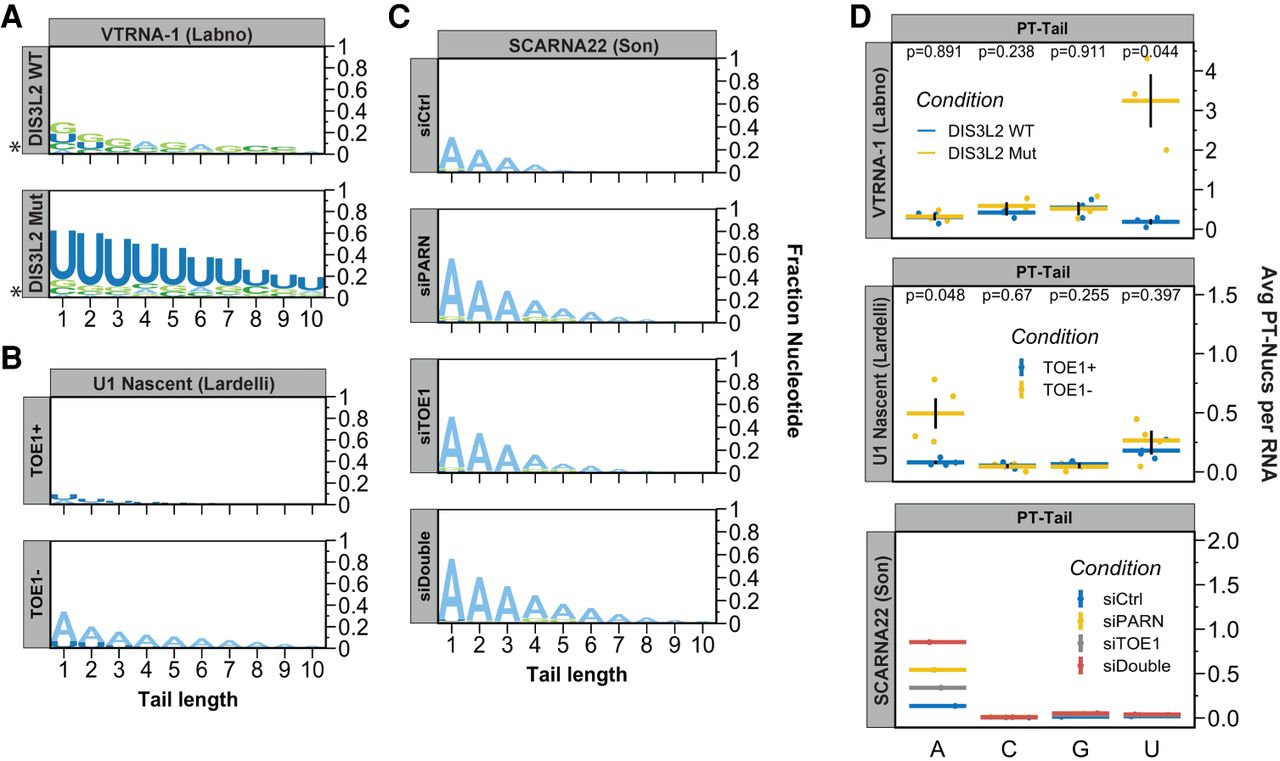
FIGURE 5.
Sample plots of post-transcriptional tailing created by Tailer-analysis. (A–C) Logo plots showing compositions of indicated RNA post-transcriptional tails as a fraction of the overall population. (D) Graphs showing average number of individual post-transcriptional nucleotides per RNA molecule as horizontal bars, with values for individual experiments shown by dots. In cases where multiple replicates are included (i.e., the Labno and Lardelli data sets), vertical lines show standard error of the mean (SEM) between experiments, and P-values from Student's t-tests are reported to monitor significance.




