


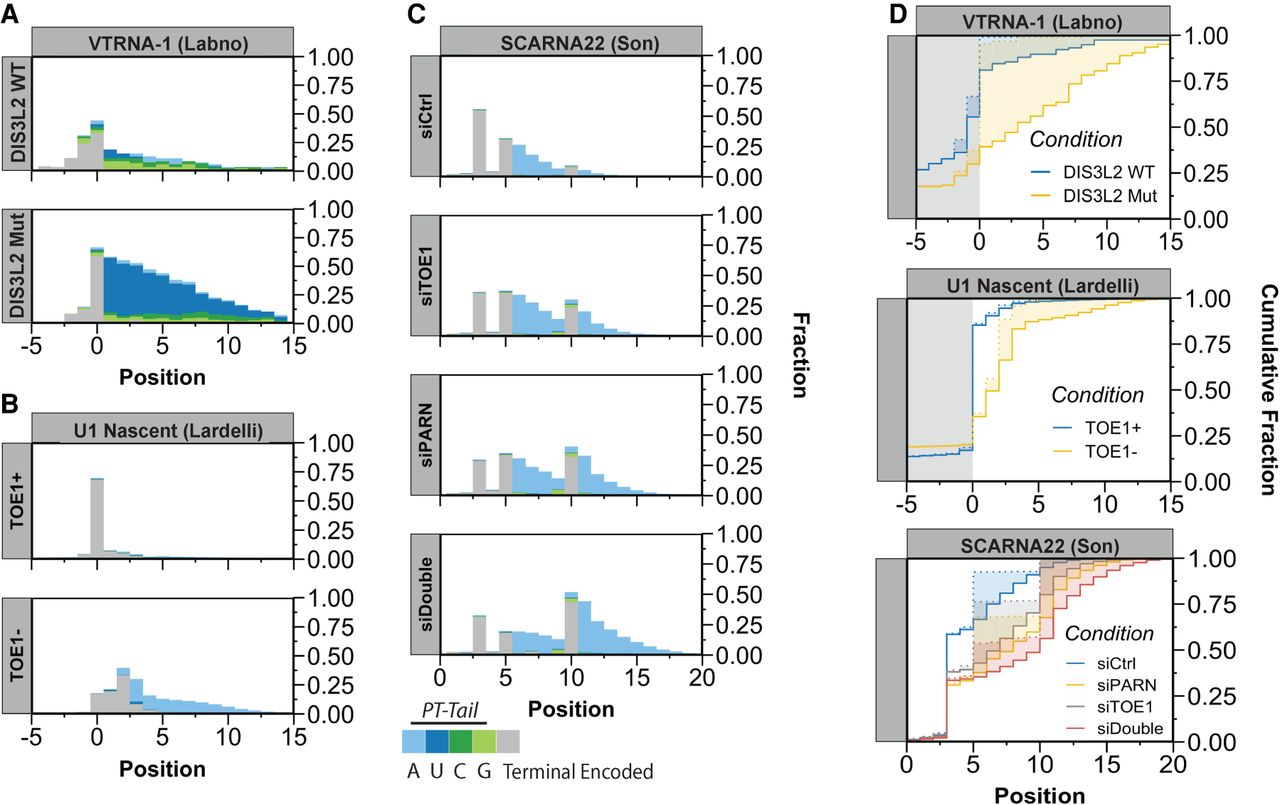
Sample plots of RNA 3′ end dynamics in response to processing factor depletion. (A–C) Tail bar graphs for indicated RNAs from the Labno (A), Lardelli (B) and Son (C) data sets, with gray bars showing the position of the terminal genomic encoded nucleotide as a fraction of the RNA population, and stacked colored bars showing the fraction of the RNA population containing post-transcriptional nucleotides at the indicated positions. (D) Cumulative plots displaying the cumulative fraction of overall 3′ end positions of the indicated RNA populations (including any post-transcriptional tail; solid lines) and the 3′ terminal genome-encoded nucleotide (dotted lines) with shading in between indicating the extent of post-transcriptional tailing. Dots to mark individual experiments can be toggled on and off using the options panel (Supplemental Fig. 1).




