


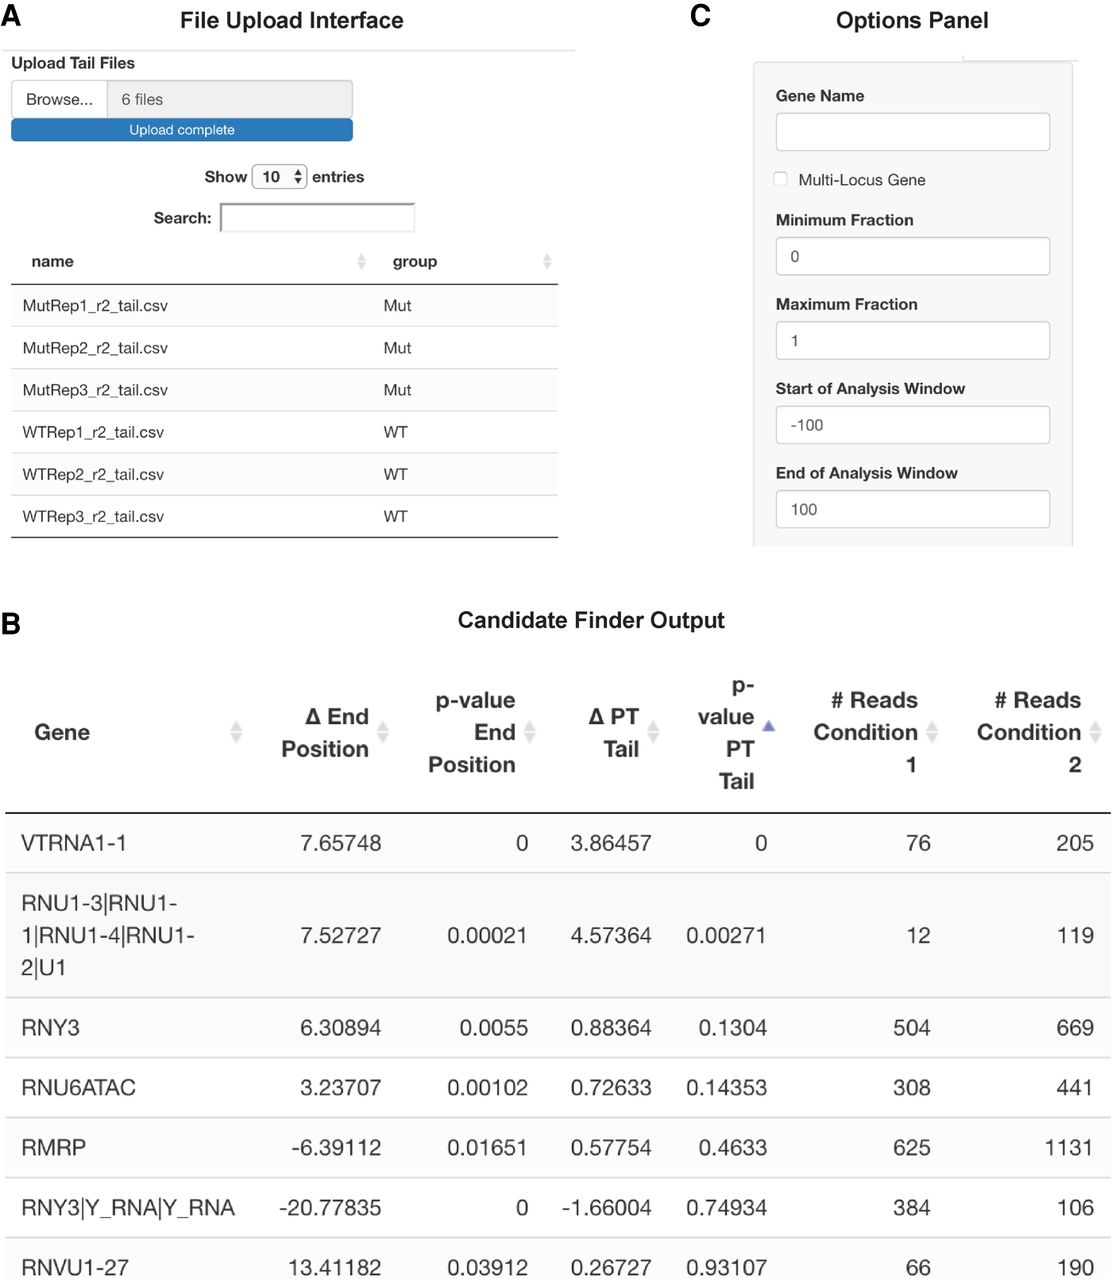
Example screenshots of the Tailer-analysis Shiny interface. (A) Individual sample tail files can be uploaded to the web server. Using the table interface, users can set grouping metadata, which will be used to bin replicates. After selecting the format data option, the user is provided with feedback on the conditions provided and number of samples. The user is also able to alter the order in which samples will be displayed using a simple drag and drop interface. (B) After uploading and setting metadata, users can use the Candidate Finder tab to rank RNAs based on their changes in tailing between the uploaded data sets. Reads can be filtered by minimum number of observations, magnitude of difference between conditions, and P-value. Hits are reported and ordered initially by statistical changes in RNA 3′ end positions but can also be reordered by statistical changes in post-transcriptional tail length by selecting the corresponding column. The candidate data can be downloaded and saved as a CSV file. (C) Every graph page contains an options side panel, which can be used to set the desired gene to be graphed and set different parameters for graphing. A checkbox for multilocus genes is available to enable a slower but more accurate analysis of RNAs produced from multiple loci (see also Fig. 6 below).




