


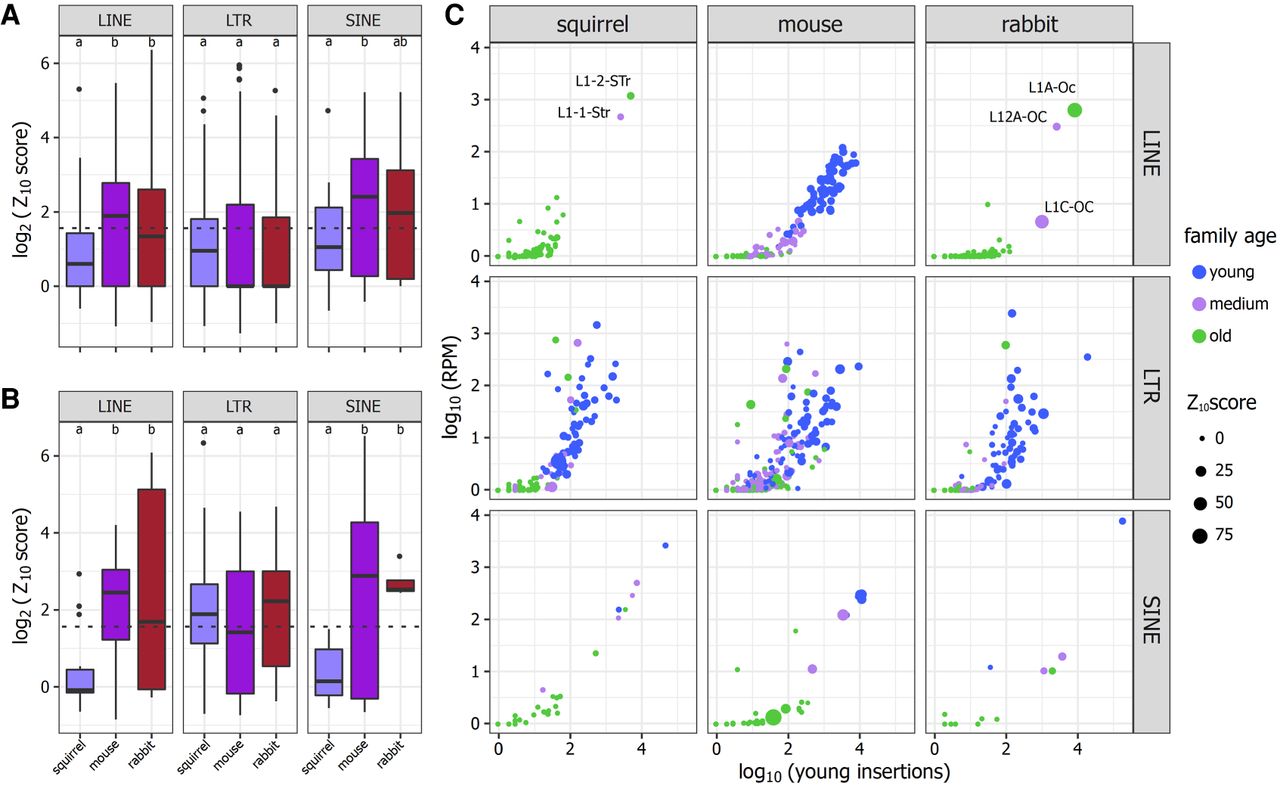
FIGURE 4.
(A) Z10 score distribution among families among species. The dotted line reflects the position of a Z10 score = 1.96, P = 0.05. Significant differences among species means (as determined by Tukey's HSD test, P < 0.05) are indicated by different shared letters. (B) Z10 score distributions calculated from young insertions. (C) Number of young insertions plotted against the expression calculated from those insertions. Families are colored based on median K2P divergence, where young families are <10%, medium are between 10% and 20% diverged, and old families are >20%. Z10 scores calculated from young insertions are reflected by the size of the point.




