


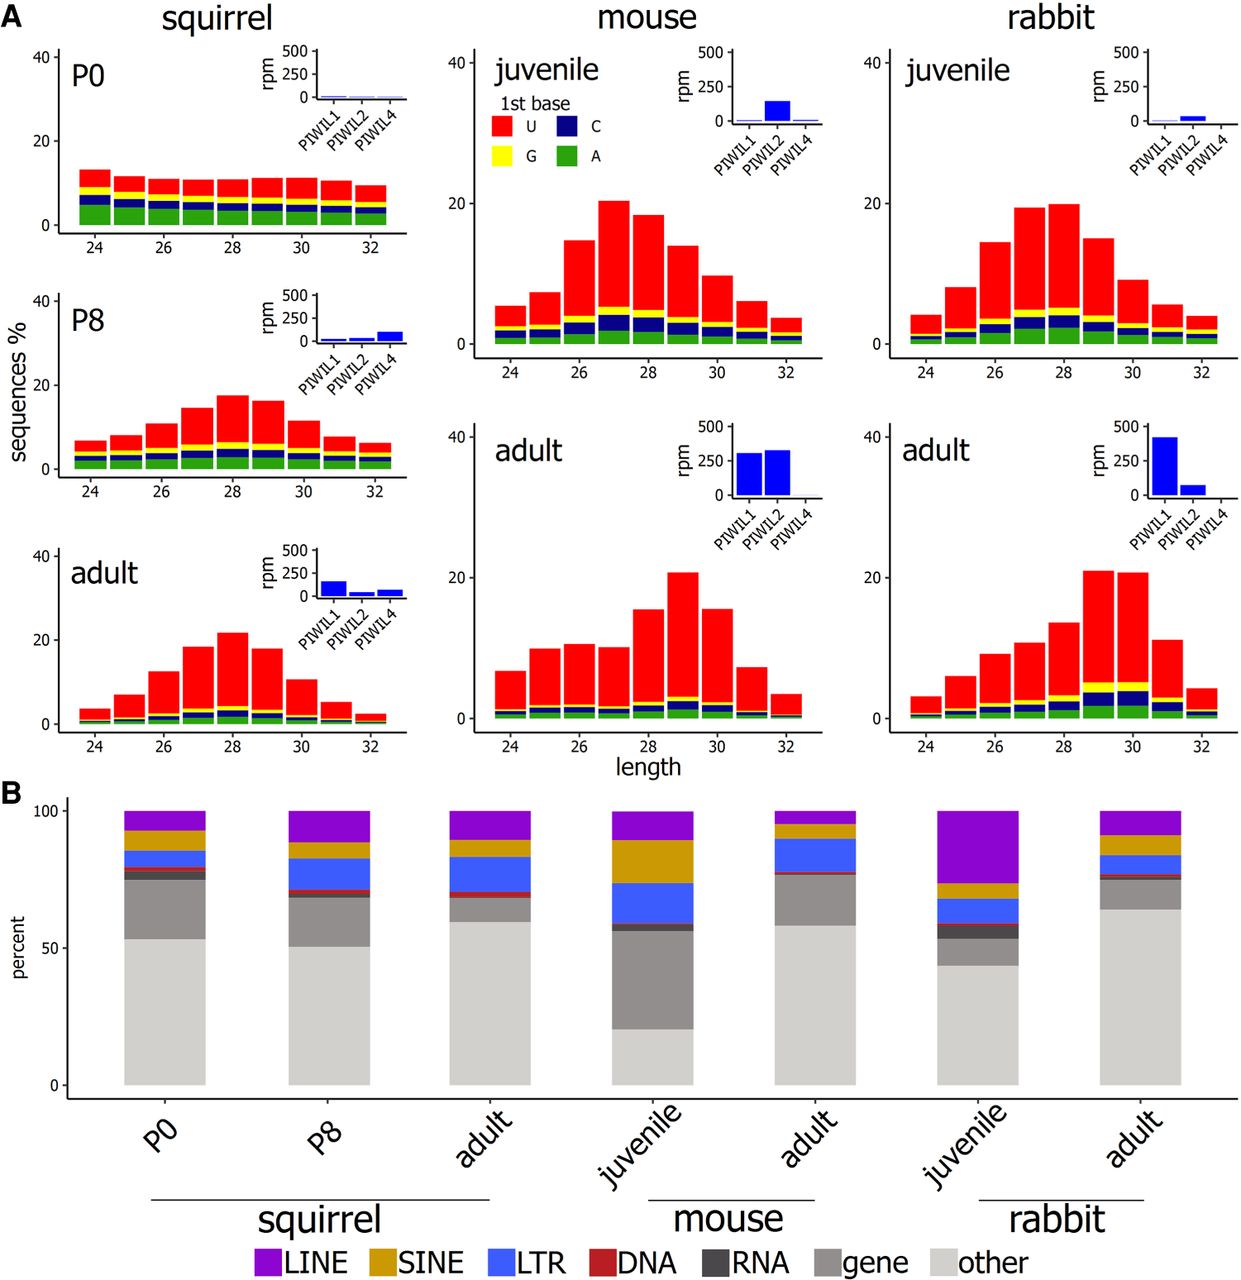
FIGURE 2.
(A) Distribution length among piRNAs between 24 and 32 nt. Colors in the stacked bar plot represent the frequency of the first nucleotide. Corresponding expression of the PIWI proteins is measured as reads per million in each sample. (B) The proportion of piRNAs that mapped to discrete regions in the genome.




