


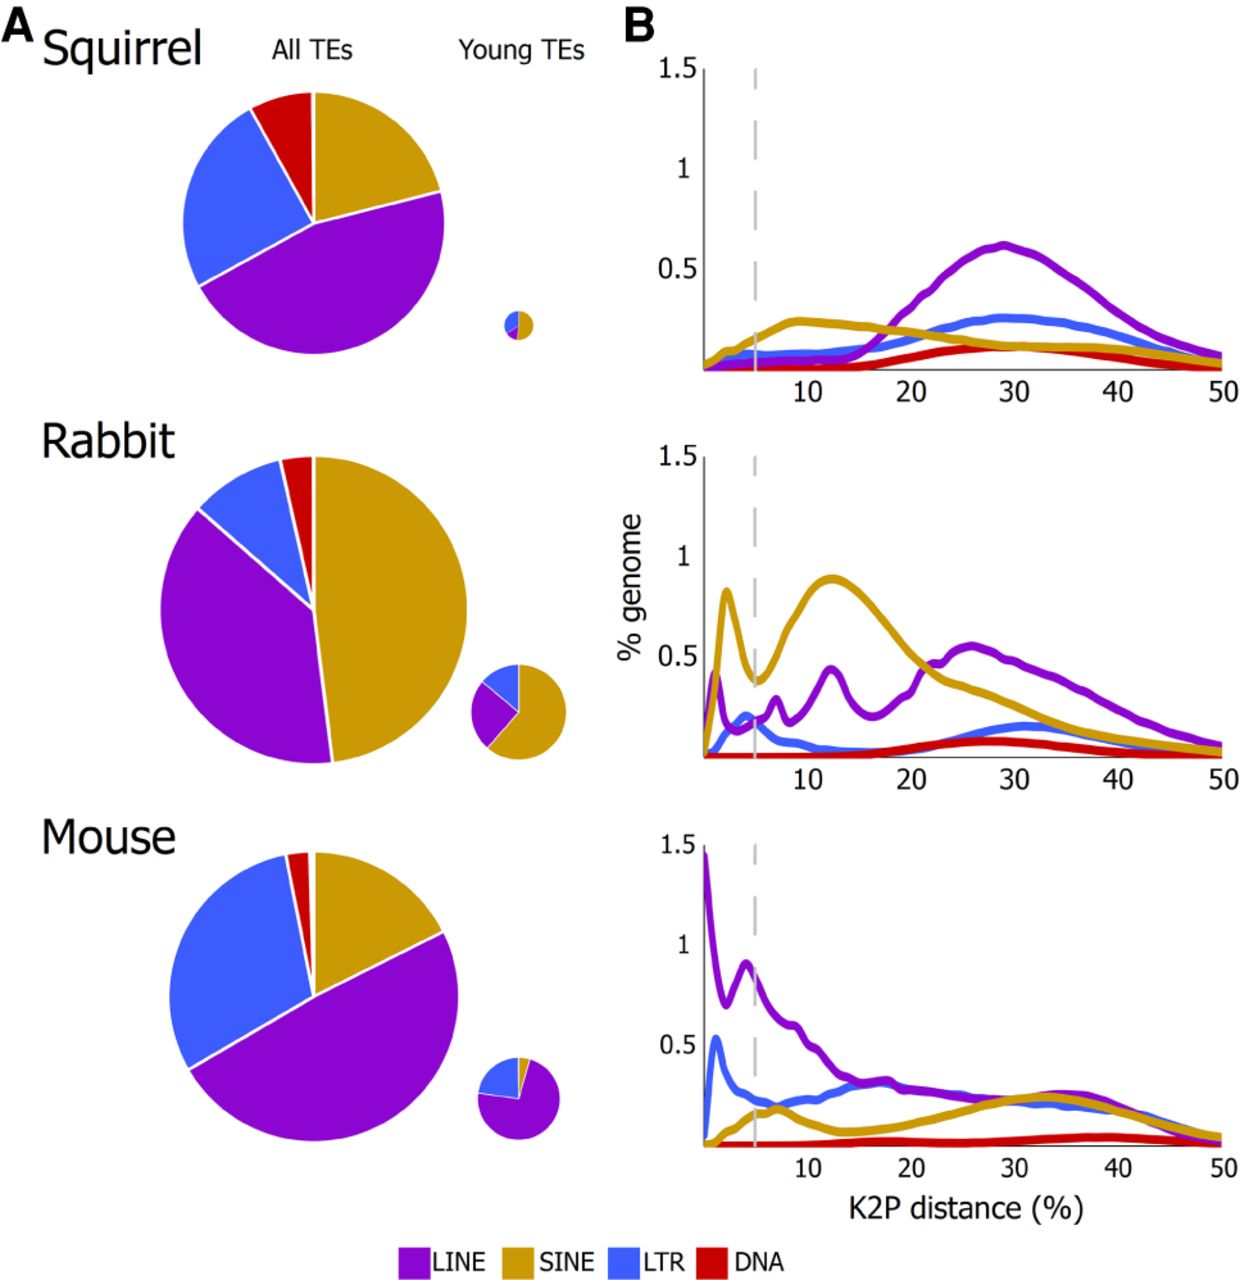
(A) Relative contribution of TEs to the corresponding genome. The small pie charts document the contribution of the more recent TE insertions, with the size of the pie chart proportional to the relative contribution of recent insertions to each genome. (B) Historical patterns of accumulation of the major TE categories inferred by calculating the Kimura 2-parameter distance between individual insertions and the corresponding consensus. Relatively young (<5% diverged) insertions to the left of the vertical line with lower genetic distances were deposited more recently. The insertions to the left of the dashed vertical lines were considered for the small pie charts.




