


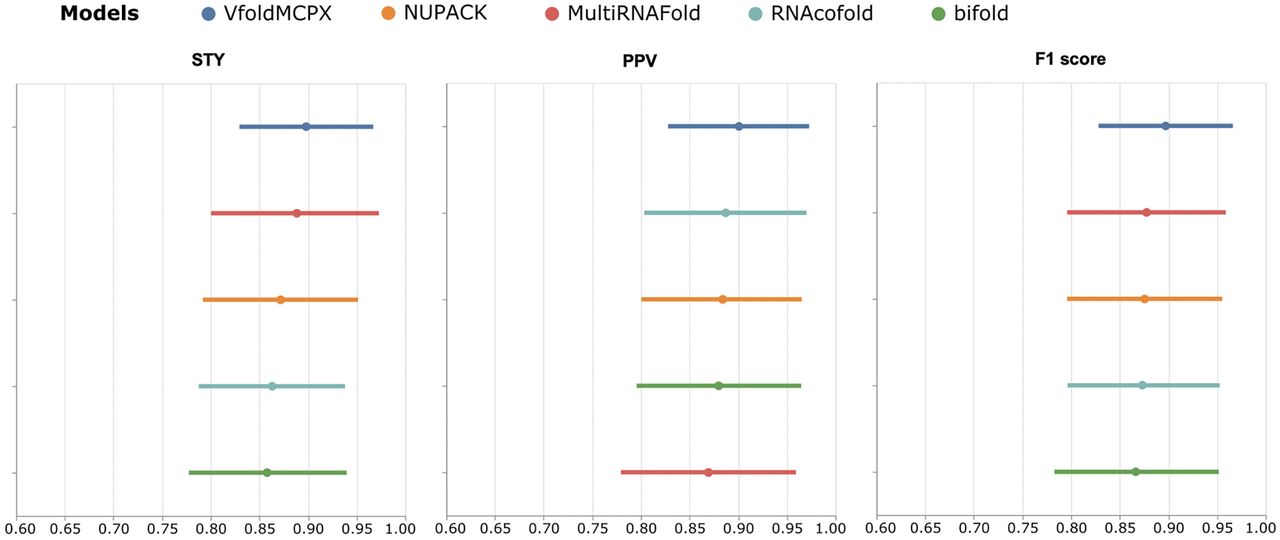
Comparison of the positive predictive value (PPV), sensitivity (STY), and F1 score between the predicted structures from VfoldMCPX, RNAcofold (Hofacker et al. 1994; Bernhart et al. 2006; Lorenz et al. 2011), bifold (Reuter and Mathews 2010), MultiRNAFold (Andronescu et al. 2005, 2007), and NUPACK (Dirks et al. 2007; Zadeh et al. 2011). The data set consists of 29 RNA-only, pseudoknot-free structures with two unique strands, obtained from the PDB database (Berman et al. 2000). Mean values are labeled and depicted as dots. Error bars are depicted using confidence intervals at 95% confidence level. Models are ranked from top to bottom according to the mean values. All the models show nearly the same performance with VfoldMCPX slightly outperforming other models in terms of mean PPV, STY, and F1 score.




