


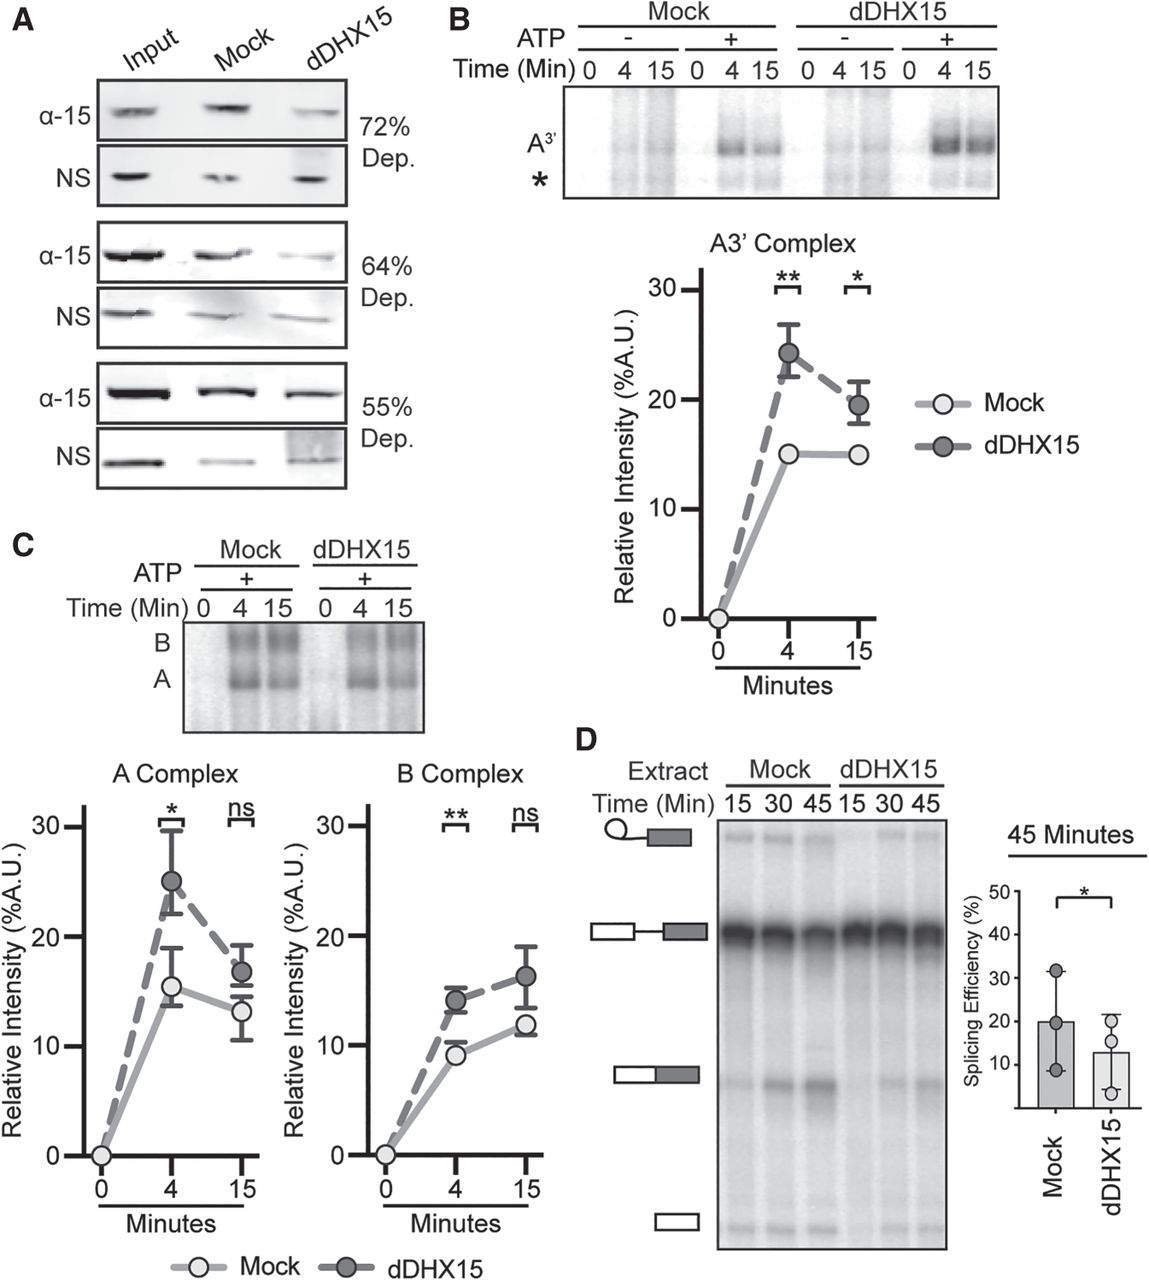
Depletion of DHX15 reduces splicing efficiency, but not spliceosome assembly. (A) Western blot analysis of three independent immunodepletions of DHX15 from HeLa nuclear extract. Depletions were quantified by comparing the band intensity of DHX15 (α-15) to a nonspecific band (NS), both normalized to the intensity of the entire lane. Samples are shown for untreated nuclear extract (Input), control depletion with 1X PBS or IgG (Mock) and depletion with anti-DHX15 (dDHX15). (B, top) Representative native gel analysis of in vitro spliceosome assembly with a radiolabeled A3′-substrate in Mock and dDHX15 nuclear extracts at the indicated timepoints. (Bottom) Normalized band intensity relative to the entire lane from three independent trials. Statistical differences were examined by paired Student's t-test with P-values as in Figure 1A. (C) Same as B, but with a full-length splicing substrate. (D, left) Representative denaturing gel analysis of radiolabeled RNA isolated at the indicated timepoints from in vitro splicing reactions using Mock or dDHX15 nuclear extracts. The RNA band identities are as described in Figure 1B. (Right) Splicing efficiency determined as in Figure 1B.




