


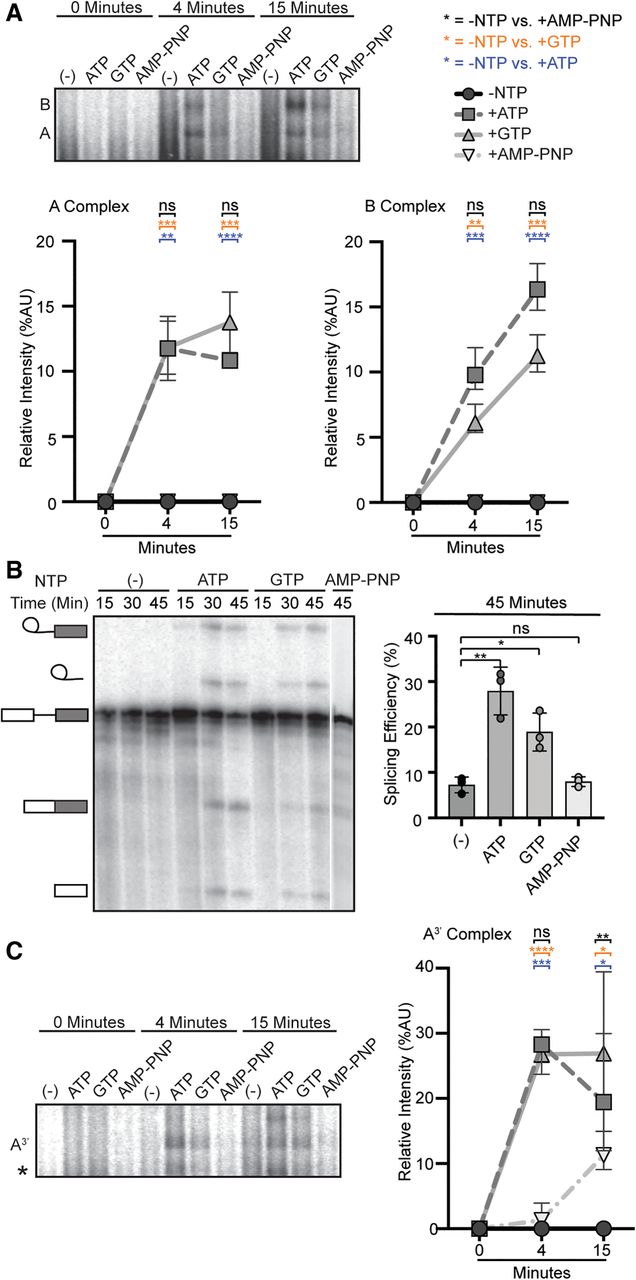
Both ATP and GTP can support spliceosome assembly and splicing. (A, top) Representative native gel analysis of in vitro spliceosome assembly with a radiolabeled full-length substrate with different added NTPs at the indicated timepoints. A- and B-complex band positions are labeled. (Bottom) Normalized band intensity relative to the entire lane for the indicated timepoints of three independent trials. Statistical differences were examined by unpaired Student's t-test with (***) P < 0.001, (**) P < 0.01, (*) P < 0.05. (B, left) Representative denaturing gel analysis of radiolabeled RNA isolated at the indicated timepoints from in vitro splicing reactions using a full-length substrate with different added NTPs. The RNA band identities are illustrated on the left as (top to bottom): lariat intron intermediate, lariat intron, pre-mRNA substrate, mRNA, and 5′ exon intermediate. (Right) Splicing efficiency is measured as intensity of the mRNA band over total RNA bands and shown for the 45-min timepoint for three independent trials. Statistical differences were examined as in A. (C) Same as A, except that an A3′-substrate was used for spliceosome assembly.




