


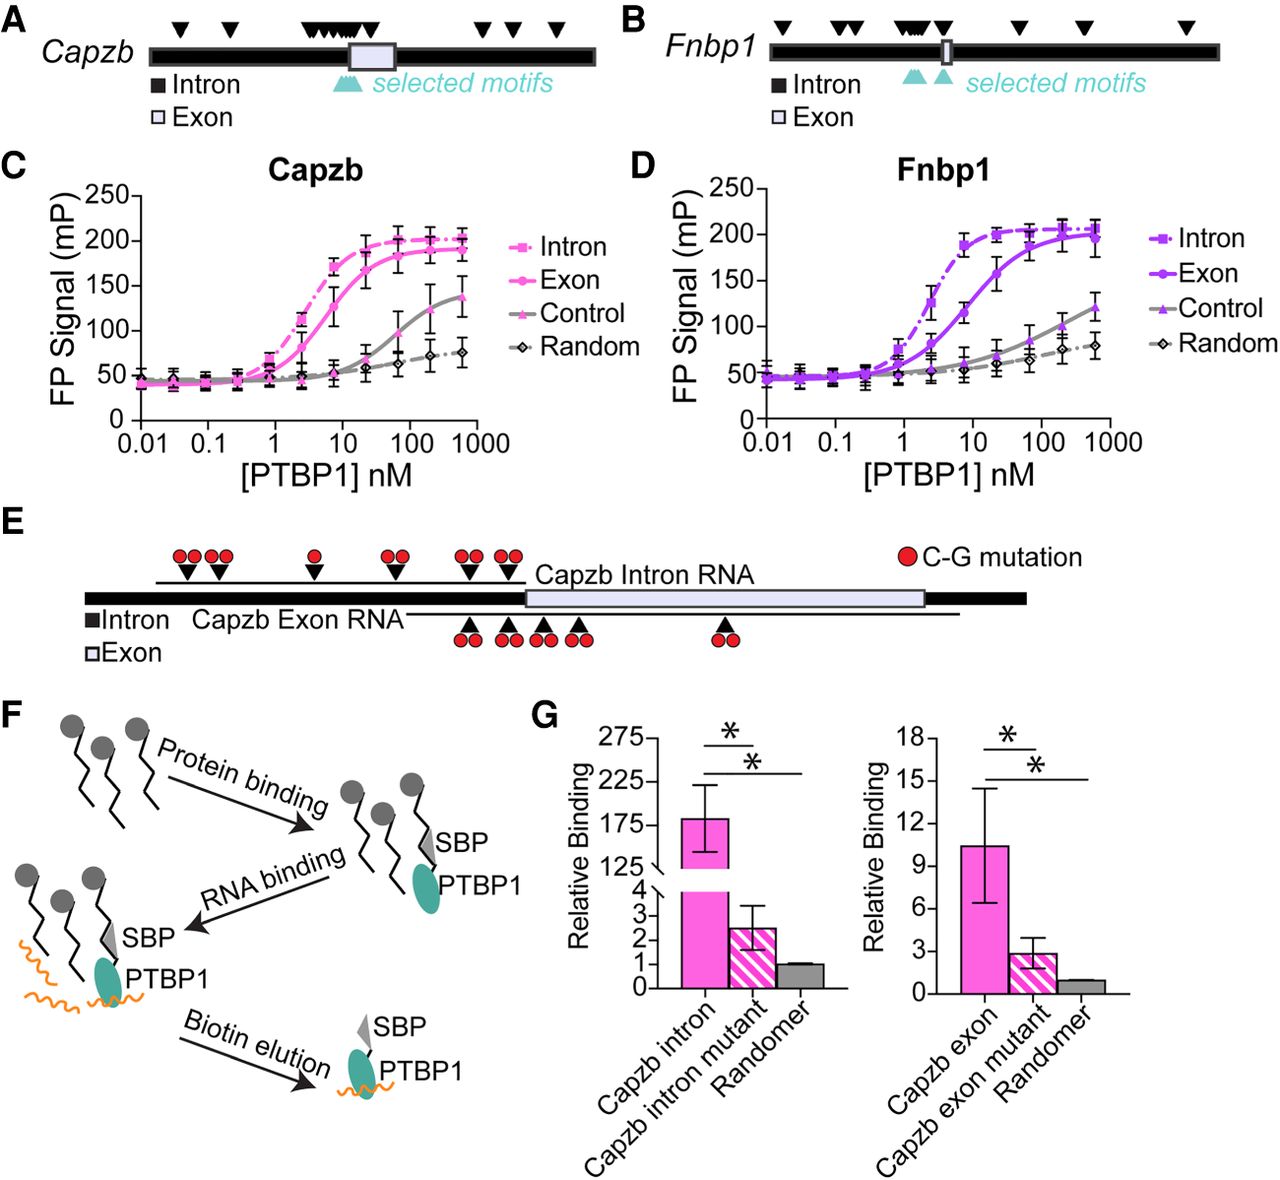
PTBP1 binds with high affinity to Capzb and Fnbp1 intronic motifs in vitro. (A) Fluorescently labeled Capzb RNA oligonucleotides overlapping selected, putative PTBP1 binding motifs (arrowheads) identified within the alternative exon and up to 500 nt of flanking intron. (B) Fluorescently labeled Fnbp1 RNA oligonucleotides overlapping selected, putative PTBP1 binding motifs (arrowheads) identified within the alternative exon and up to 500 nt of the flanking introns. (C) Fluorescence polarization binding curves for Capzb RNA oligonucleotides incubated with PTBP1. Intron KD ∼ 3 nM (SD = 0.2 nM), exon KD ∼ 6 nM (SD = 2 nM). (D) Fluorescence polarization binding curves for Fnbp1 RNA oligonucleotides incubated with PTBP1. Intron KD ∼ 2 nM (SD = 0.9 nM), exon KD ∼ 8 nM (SD = 6 nM). (E) Capzb RNA oligonucleotides with wild-type or mutant putative PTBP1 motifs. (F) Schematic of Bind-n-qPCR assay. (G) PTBP1 binding enrichment to Capzb RNA oligonucleotides shown in panel E. Fluorescence polarization shows cumulative data with three replicates (n = 3). qPCR binding assays show cumulative data of replicates (n = 5). Significance was determined via one-tailed t-test, (*) P < 0.05.




