


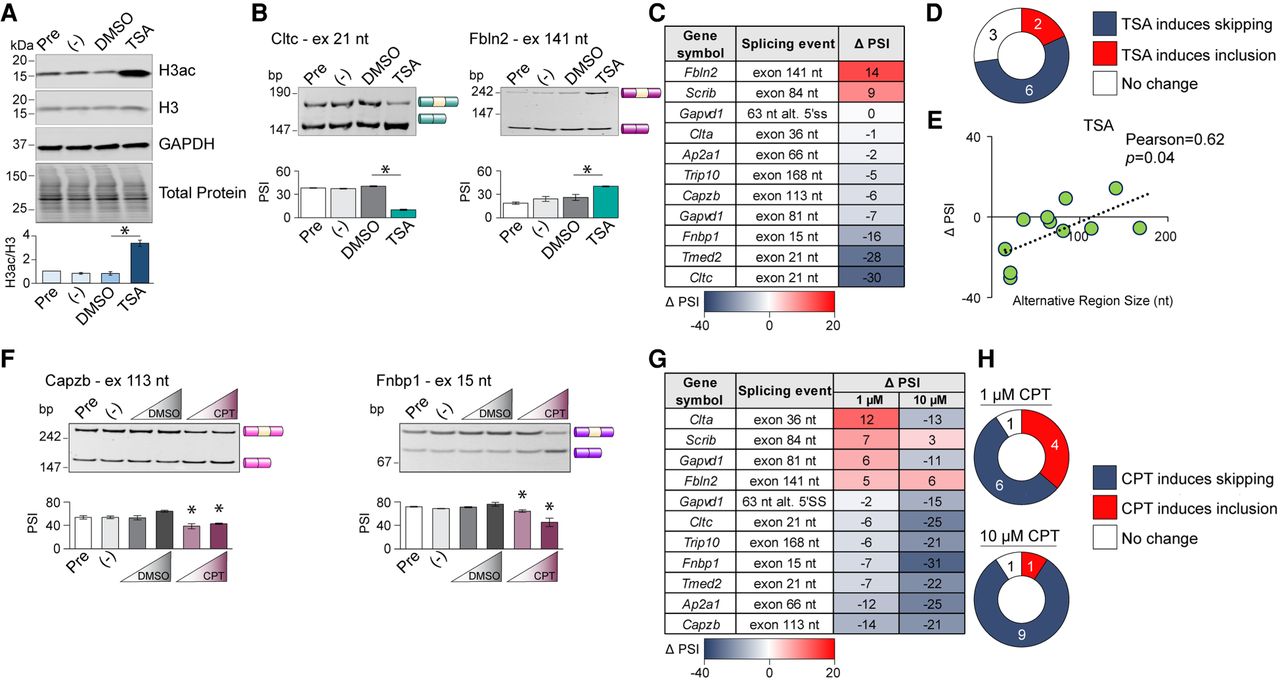
Trichostatin A (TSA) and camptothecin (CPT) treatment influence alternative splicing outputs. (A) Western blot assays were performed using lysates from myotubes treated with TSA. Untreated cells were collected before (Pre) and 16–18 h after (−) TSA treatment. The ratio of acetylated histone H3 (H3ac) to total histone H3 was quantified by densitometry. (B,C) After treatment with TSA, splicing of trafficking genes was determined in myotubes by RT-PCR and PSI was quantified via densitometry. (D) Pie chart of splicing events that respond to TSA treatment. Skipping and inclusion were defined as events with a ΔPSI ≤ −5 and ΔPSI ≥ 5, respectively. (E) Scatterplot of alternative region size and ΔPSI. (F,G) Myotubes were treated with CPT (1 or 10 µM), splicing of trafficking genes was evaluated by RT-PCR, and PSI was quantified via densitometry. (H) Pie chart of splicing events that respond to CPT treatment. ΔPSI was defined as the difference between the PSI under TSA or CPT treatment and the PSI when an equal volume of DMSO (vehicle) was added. Results are shown as mean ± SEM, n = 3–6, (*) P < 0.05, Welch's t-test, TSA or CPT treatment versus an equal volume of DMSO. (bp) Basepair, (DMSO) dimethyl sulfoxide, (KDa) kilodalton, (nt) nucleotide, (PSI) percent spliced in.




