


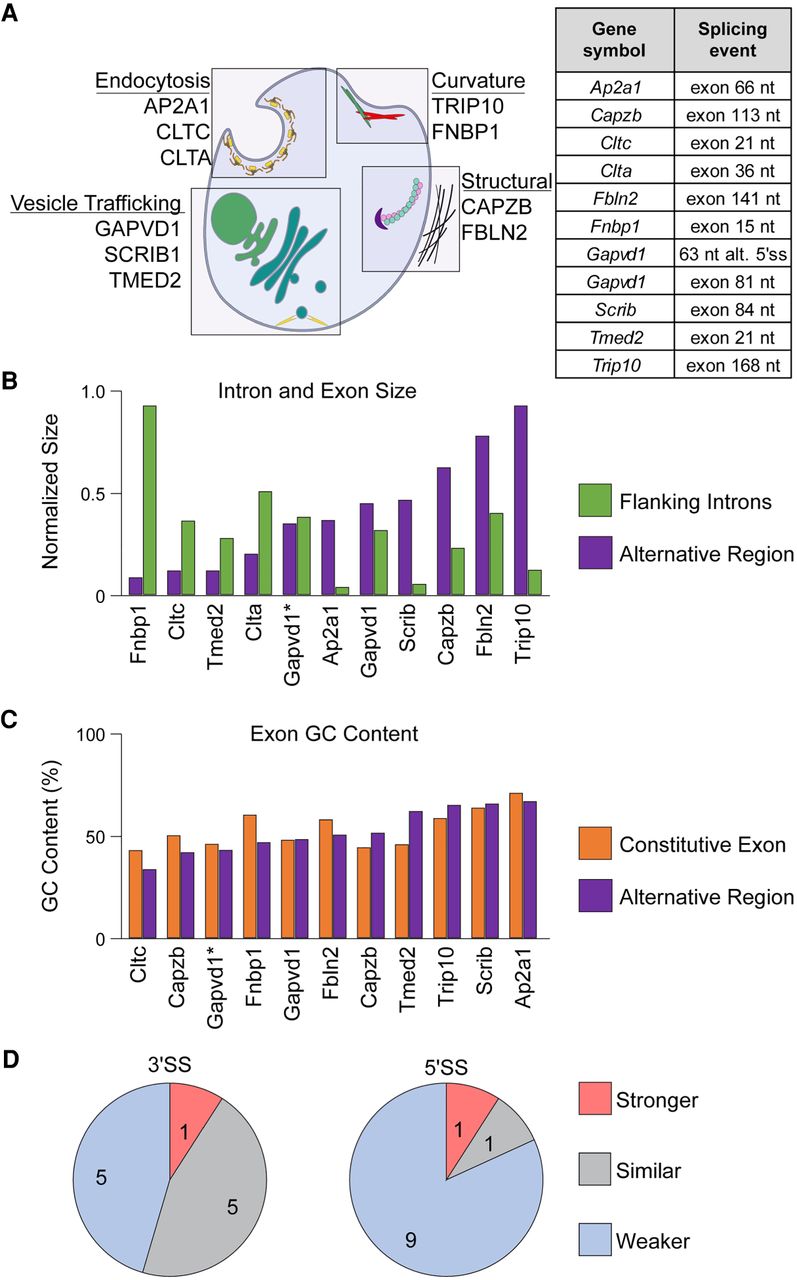
Characterization of a panel of splicing events in membrane trafficking genes. (A) Schematic representation of 10 proteins with functions related to membrane trafficking (left) and the size of the alternatively spliced region (right). (B) Relationship between the size of the alternative region and the sum of the sizes of the flanking introns. Sizes of the alternative region and the flanking intron were normalized to the largest exon or intron. *Gapvd1 denotes the alternative splice site (alt. 5′ss) in Gapvd1 pre-mRNA, which leads to an alternative region of 63 nt. (C) Quantification of GC content of alternative regions and their upstream constitutive exons. (D) Analysis of the strength of the alternative splice sites as scored by MaxEntScan. Stronger and weaker alternative splice sites were defined as those with a score 10% higher or lower than their corresponding constitutive splice sites, respectively.




