


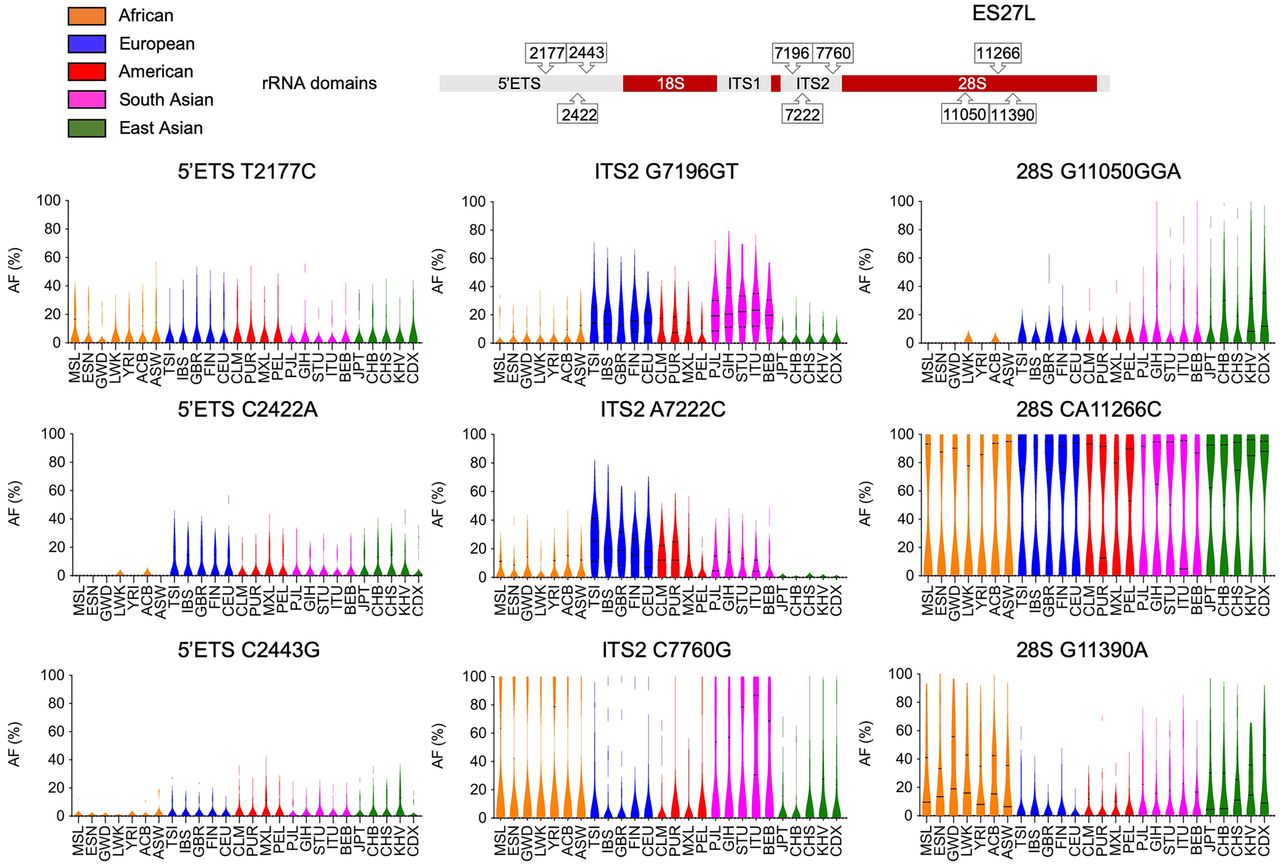
FIGURE 7.
Population stratification of variants. Population distribution of intra-individual variant frequencies of selected 5′ ETS, ITS2, and 28S rRNA positions are shown as violin plots. Solid lines, median; dashed lines, quartiles. Populations are color-coded according to their superpopulations. Top, rRNA coding regions and variant positions.




