


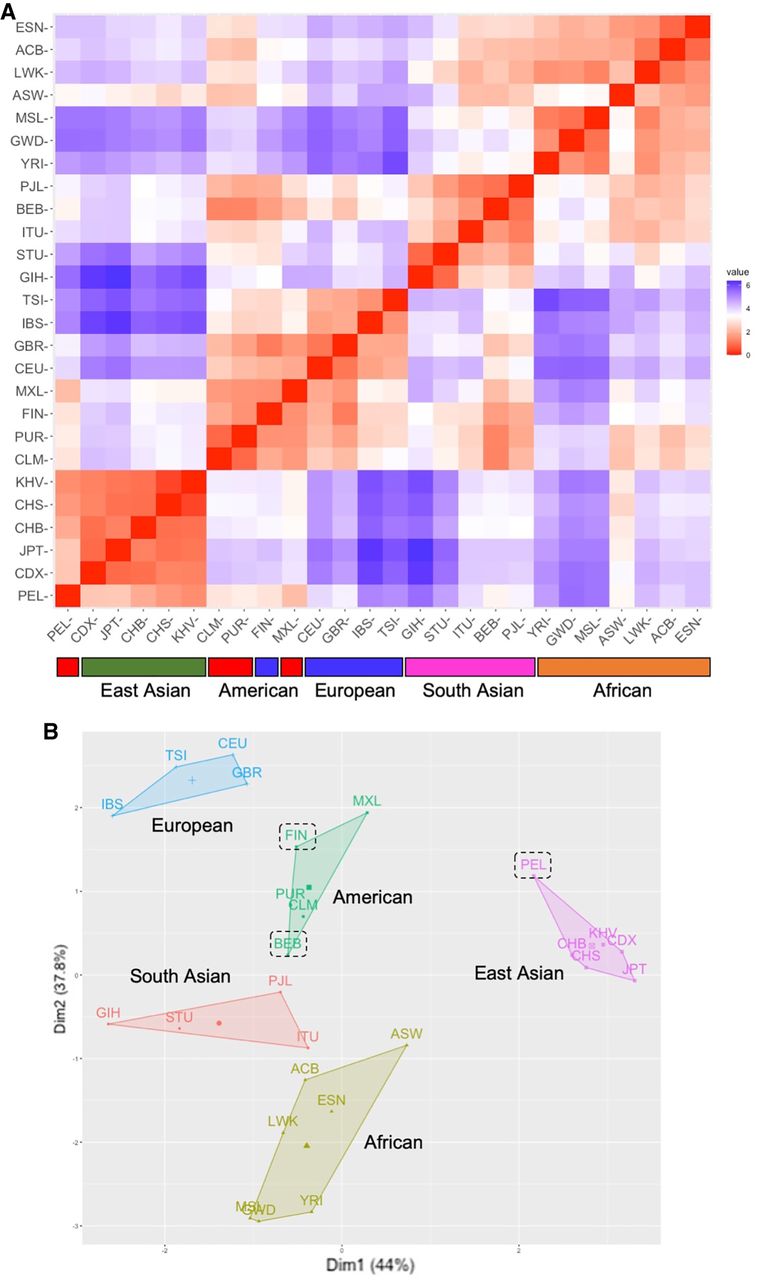
FIGURE 6.
Multidimensional scaling of variants. (A) Euclidian distance matrix analysis. Variant positions (2422, 7196, 7222, 7234, 7443, 7460, 7760, 11390) were used to calculate the average variant frequency for each population per position. Below, superpopulations are indicated by color codes. (B) K-means clustering analysis was conducted based on the variance in each population. Clusters of superpopulations are indicated. Dashed lines indicate outlier populations in the cluster.




