


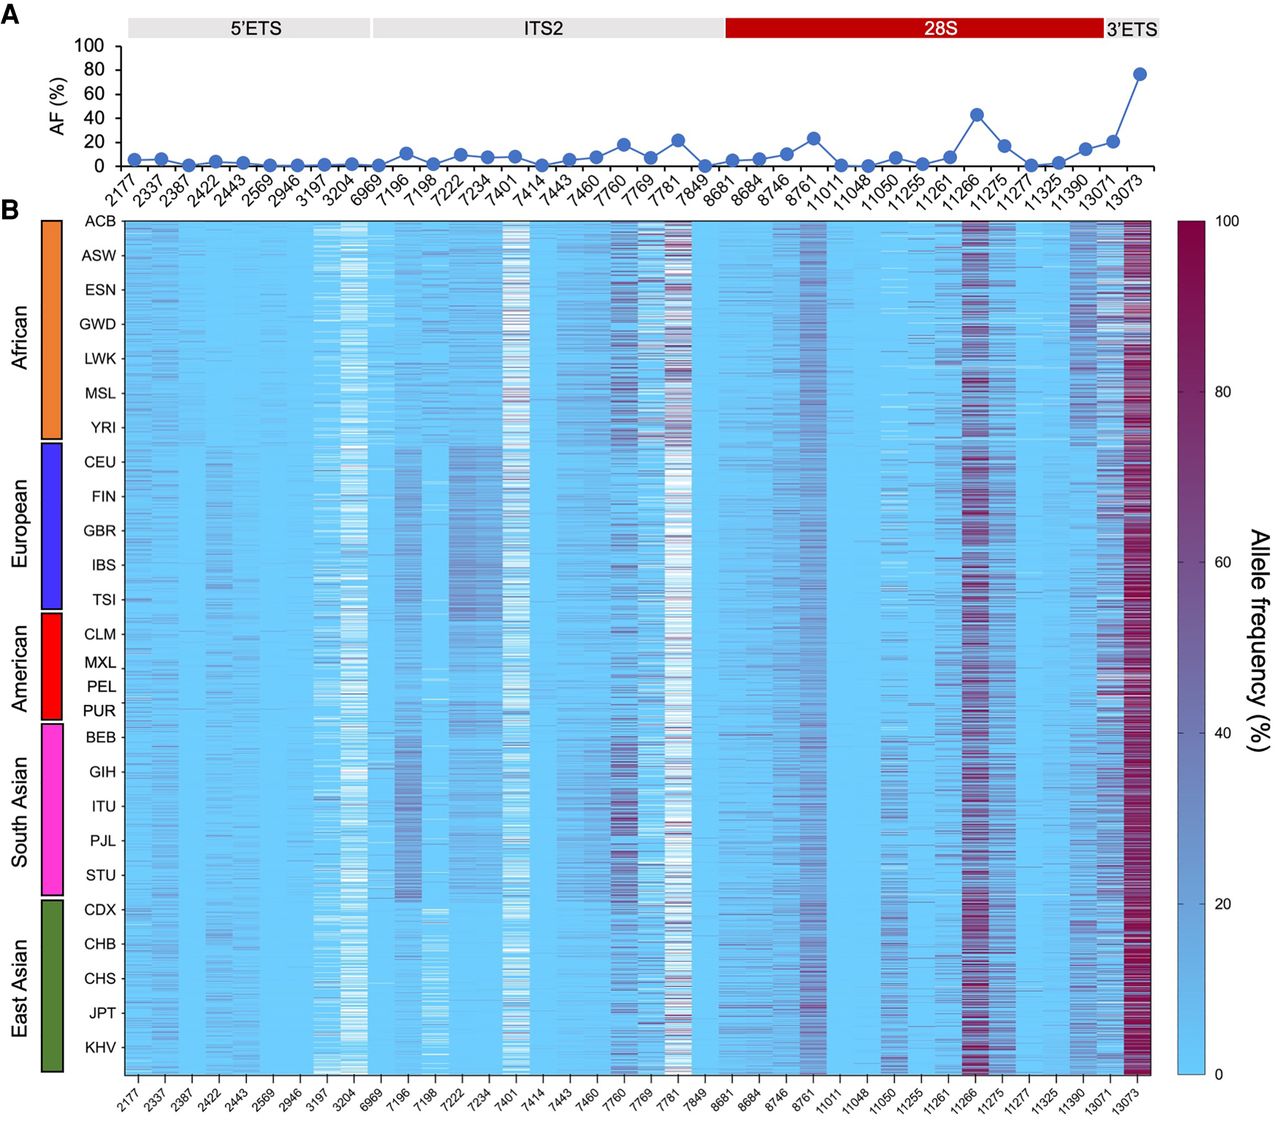
FIGURE 5.
Population-wide analyses of the RNA-validated genomic variants. Variant allele frequency was calculated as the number of variant reads/number of total reads for each position and is expressed as %. (A) Average allele frequency (%) per position. (B) Supervised heat map organized by population (y-axis) and position (x-axis). Superpopulations are indicated by color codes, and populations are abbreviated using their 1000 Genomes Project acronyms. Heatmap is depicted as light blue to maroon gradient. White cells, no data.




