


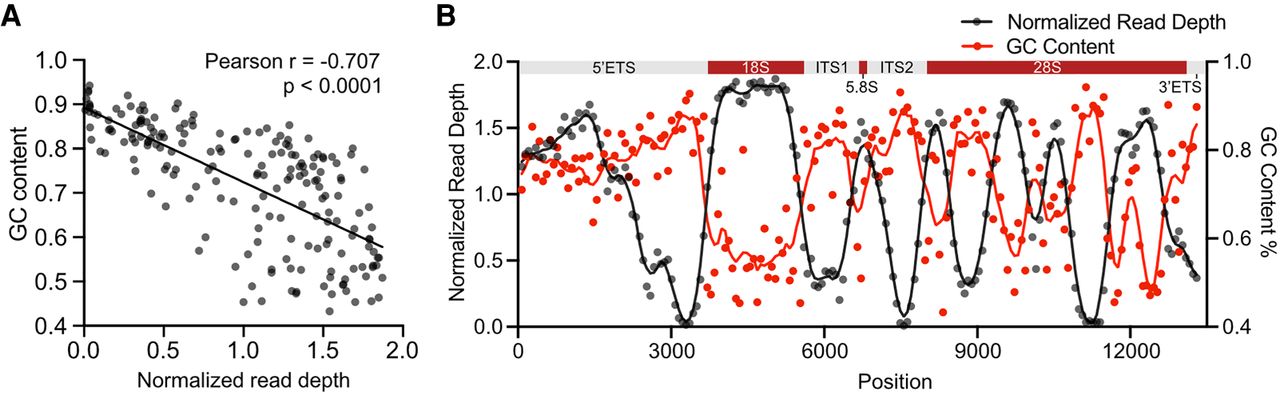
FIGURE 2.
WGS sequence read depth anticorrelates with rDNA GC content. (A) Scatter plot showing GC content as compared to the normalized mean read depth in rDNA coding region. High coverage WGS data were obtained from 70 cancer cell lines in the CCLE database. P was determined by two-sided Pearson's correlation test. (B) Normalized read depth and GC content are plotted across the rDNA coding region. (Top) rRNA coding regions.




