


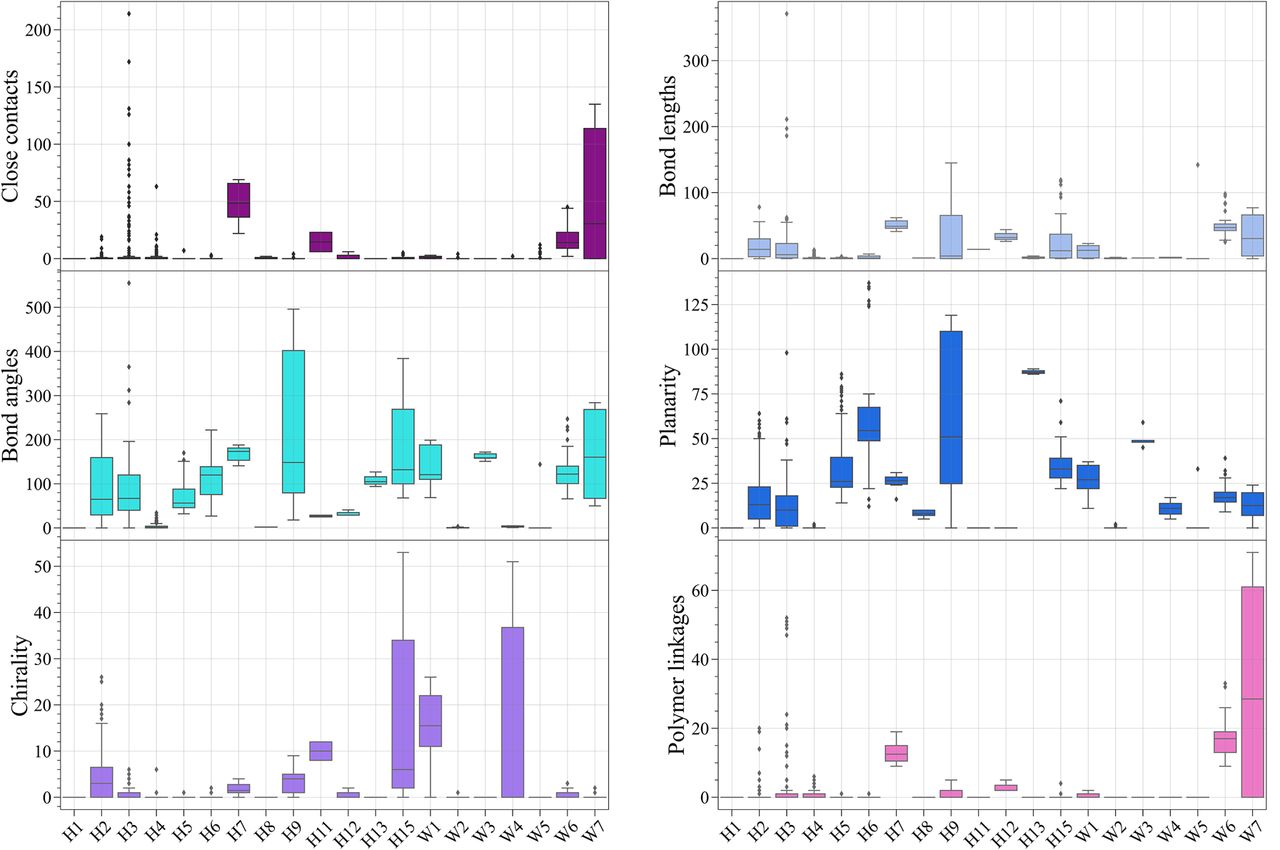
FIGURE 3.
The number of identified stereochemical errors per error type and participant. The box plot of each participant shows the interquartile range. The black middle line in every box depicts a median. The first and third quartiles are represented as wicks up and down from the interquartile range. Separated dots outside boxes correspond to outliers.




