


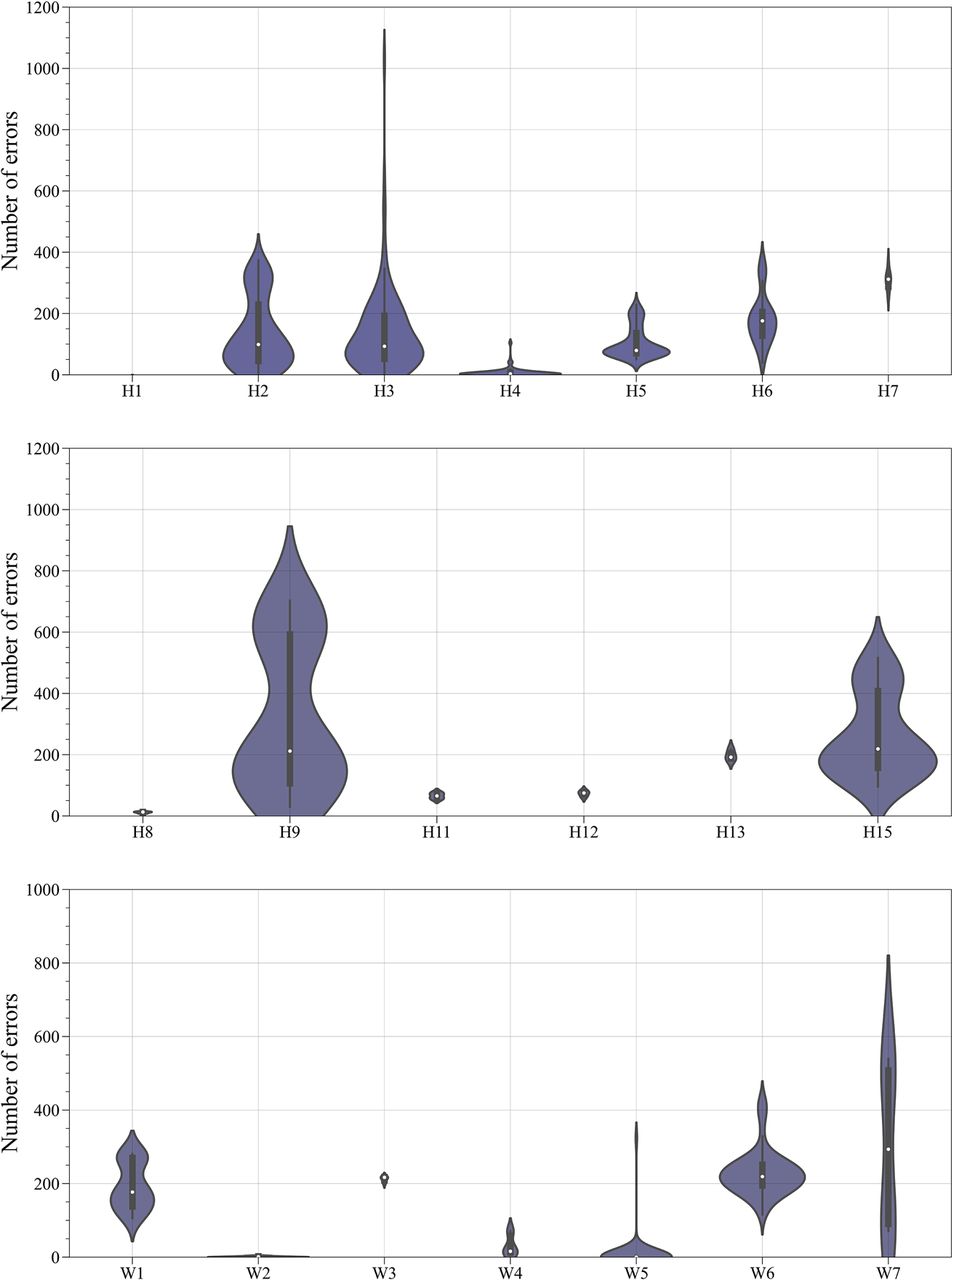
FIGURE 2.
The number of stereochemical errors identified in all the considered models by participants. The white dot at the center of every violin plot represents a median. The black bar corresponds to the interquartile range. The first and the third quartile are represented as wicks up and down from the interquartile range. The violin shape shows error distribution.




