


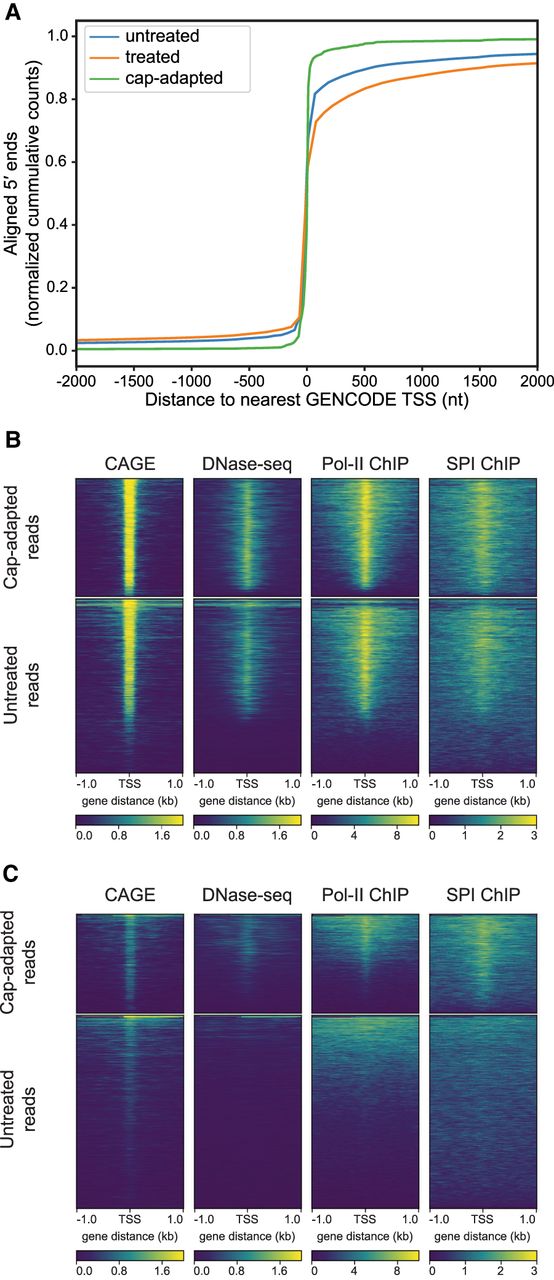
Correspondence between RNA nanopore 5′ end reads and orthogonal TSS evidence. (A) Nucleotide distance of RNA 5′ ends from annotated GENCODE TSS. The x-axis is the number of nucleotides between a nanopore read 5′ end and the closest TSS annotated in GENCODE v.32. Negative numbers are upstream (5′) from the TSS; positive numbers are downstream (3′) from the TSS. The y-axis is the cumulative number of RNA nanopore reads at a given distance of their 5′ end from an annotated GENCODE TSS. Values are normalized as a fraction of total counts for a given treatment. (B) Comparison of poly(A) RNA nanopore 5′ end reads to orthogonal TSS markers. Each plot is a heatmap where the x axis is a ±1 kb window centered on the genomic position defined by the 5′ end of each RNA nanopore read. Each row in the y-axis is a genomic region defined by individual reads. The color intensity is the read depth normalized signal (CAGE, DNase-seq) or fold change over control for each position (POLR2 and SPI1). The top plots are cap-adapted reads, the bottom plots are untreated reads. (C) Comparison of unannotated RNA nanopore 5′ end reads to orthogonal TSS markers. Unannotated 5′ ends are defined as positions where the 5′ end of at least two reads are aligned within 50 nt of each other and more than 300 nt away from any annotated TSS. The number of reads in each plot was down-sampled to 9116 reads and then filtered for only unique positions (total number of unannotated cap-adapted reads).




