


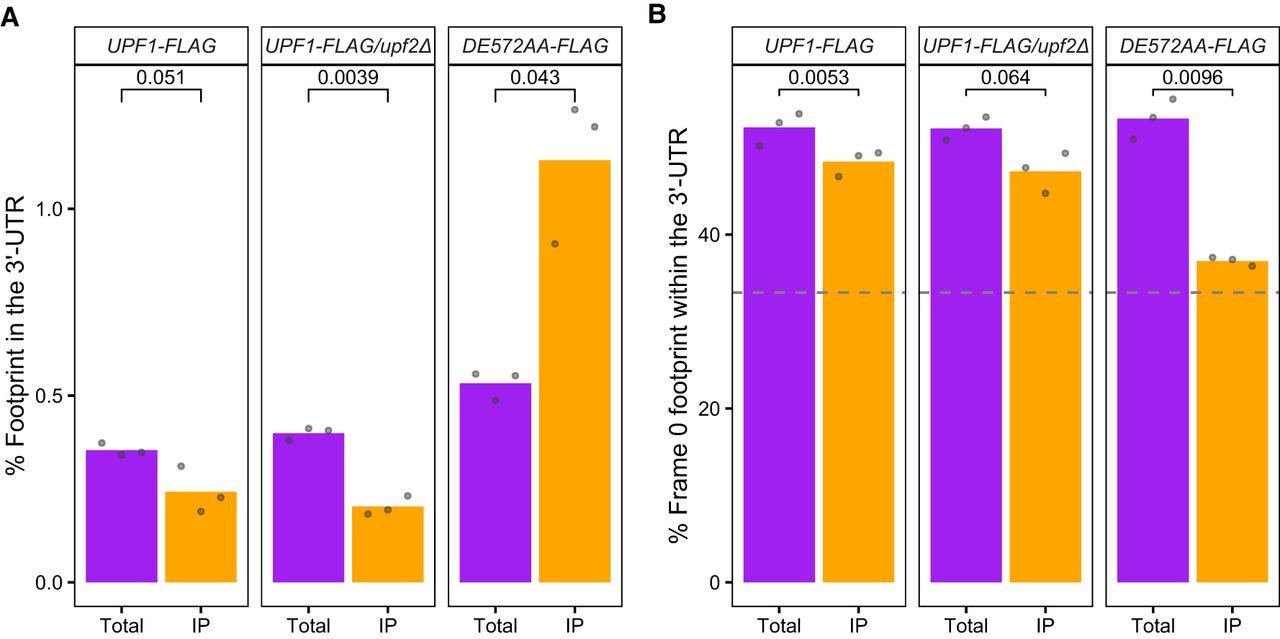
FIGURE 7.
Percentage of footprints in the 3′-UTR region. (A) Percentage of footprints whose P-sites fall into the 3′-UTR region for each library. (B) Percentage of frame 0 footprints within the 3′-UTR region. Horizontal gray dashed line indicates a theoretical percentage of 33% where all three reading frames would be equally represented. For both A and B, percentage calculated from each replicate was plotted as a gray dot. Bar plot represents the average among the three replicates. Two-tailed paired t-test was used to determine significant differences between percentages from IP and Total libraries.




