


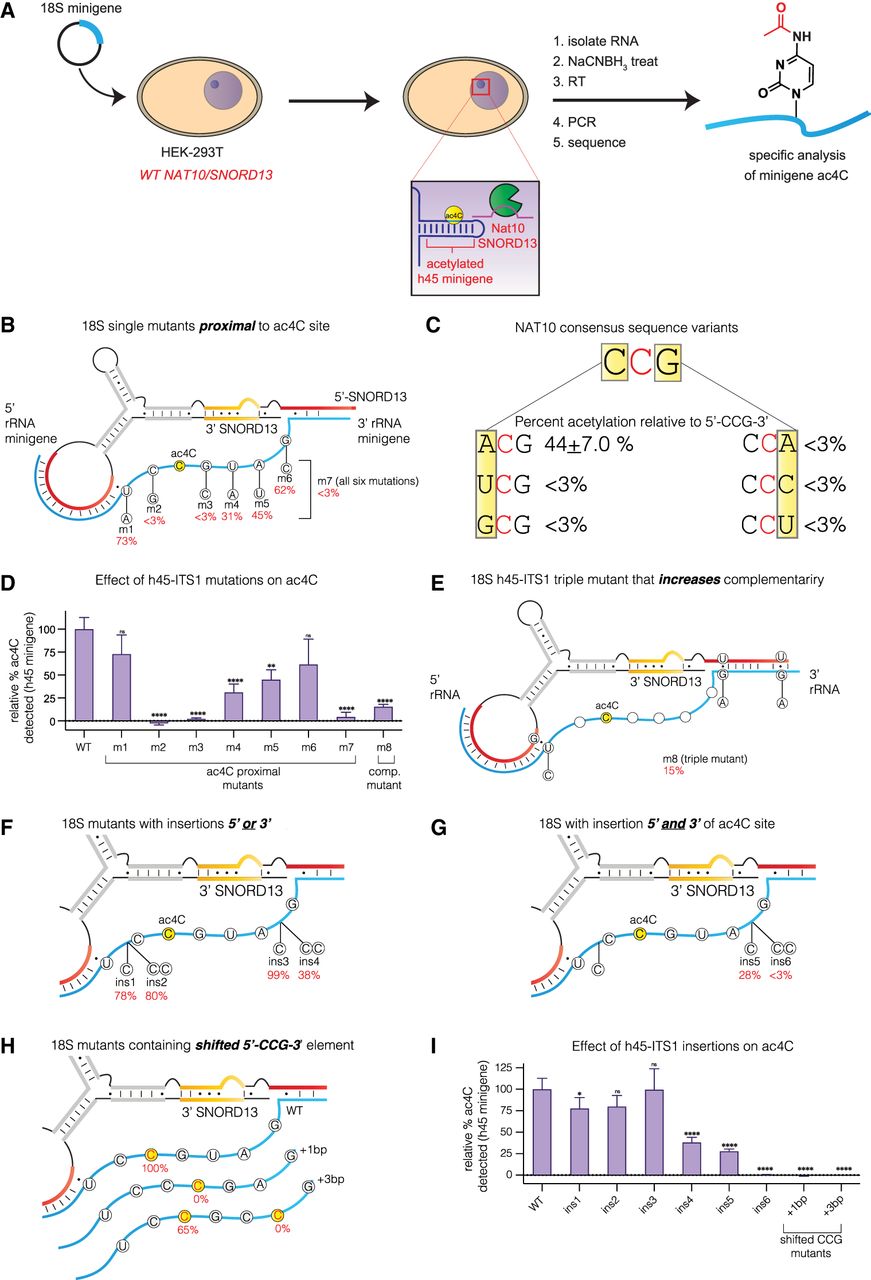
(A) Schematic for analysis of endogenous SNORD13 substrate specificity using a Pol I-transcribed pre-rRNA h45-ITS1 minigene substrate and quantitative ac4C sequencing. (B) Structure of h45-ITS1 substrates with mutations lying proximal to natural ac4C site. Values in red represent ac4C-dependent misincorporation rates normalized relative to the WT h45-ITS1 sequence, which was set to equal 100%. (C) Summary of percent misincorporation observed upon mutation of 5′-CCG-3′ consensus sequence in h45-ITS1 substrates. (D) Bar graph of mutants specified in Figure 5B and E. Values represent n = three biological replicates, analyzed by two-tailed Welch's t-test in comparison to WT (ns = not significant, [*] P < 0.05, [**] P < 0.01, [***] P < 0.001, and [****] P < 0.0001) (E) Structure of “triple mutant” h45-ITS1 substrate engineered to have increased complementarity to SNORD13. (F,G). Structure of h45-ITS1 substrates with bases inserted 5′ and/or 3′ relative to the 5′-CCG-3′ consensus sequence. (H) Structure of h45-ITS1 substrates in which the 5′-CCG-3′ consensus sequence is shifted 1 bp (+1 bp) or 3 bp (+3 bp). (I) Bar graph of mutants specified in Figure 5F–H. Values represent n = three biological replicates, analyzed by two-tailed Welch's t-test in comparison to WT (ns = not significant, [*] P < 0.05, [**] P < 0.01, [***] P < 0.001, and [****] P < 0.0001). Exemplary sequencing traces provided in Supplemental Figure S6 and Supplemental Figure S8b.




