


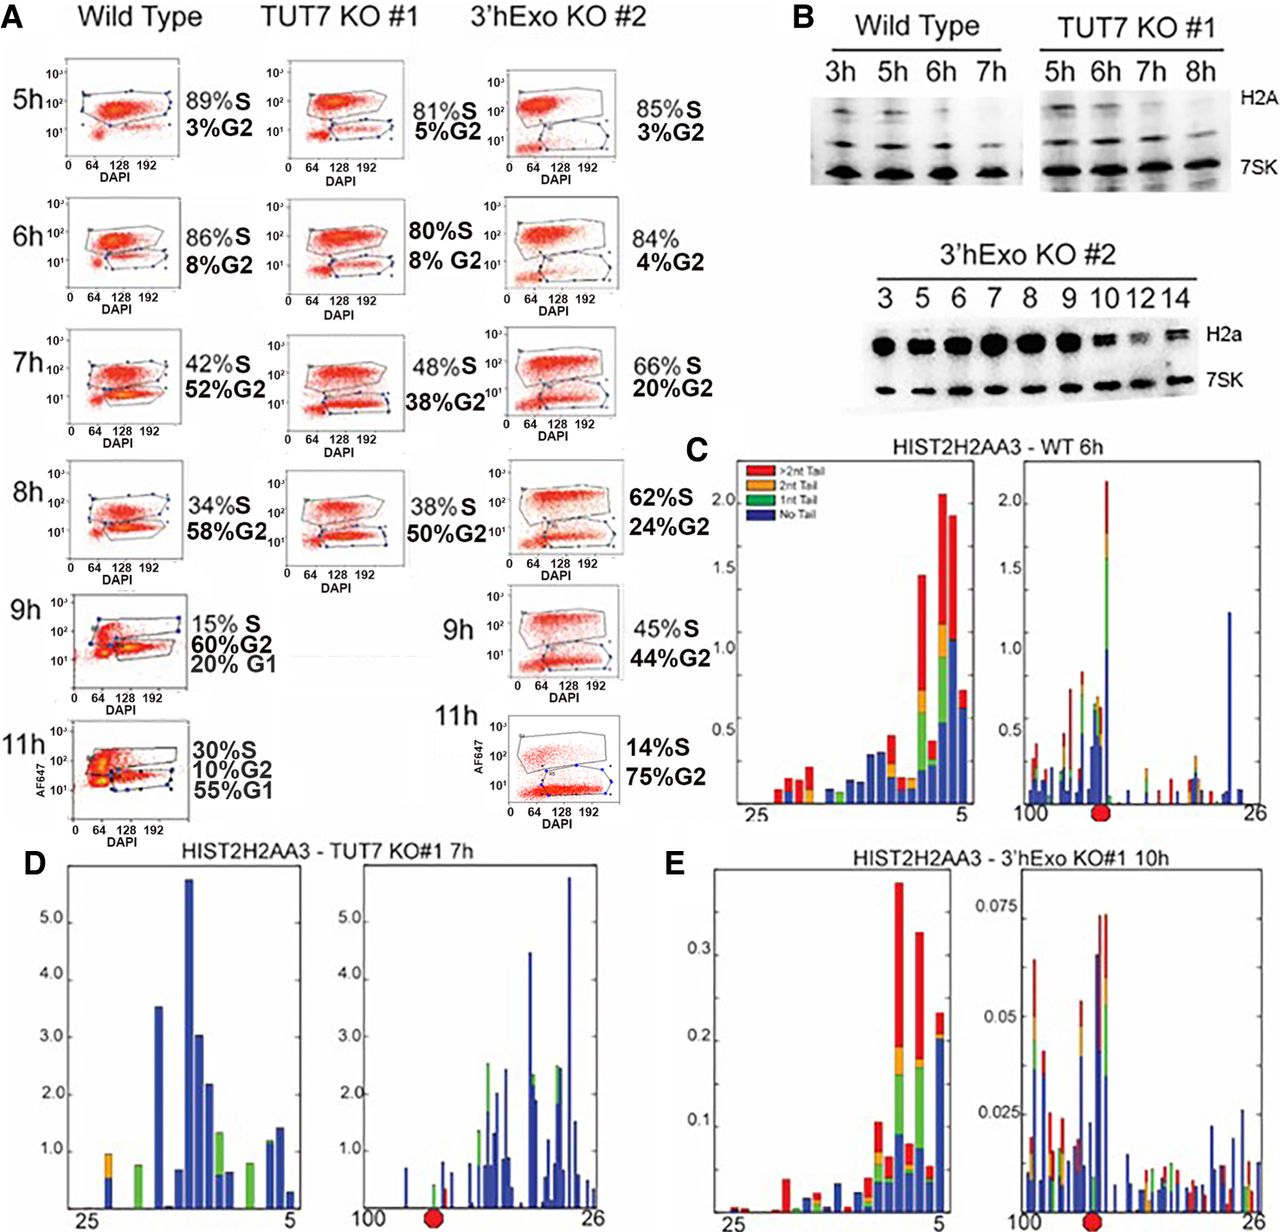
Histone mRNA metabolism during the cell cycle in the TUT7 and 3′hExo KO cells. (A) Flow cytometry analysis. Parallel cultures of the WT, TUT7, and 3′hExo KO cells were synchronized by double thymidine block and cells analyzed by flow cytometry starting 3 h after release. About 93% of the WT entered the cell cycle (note the number of cells that stayed arrested in the bottom left); about 88% of the TUT7 and 3′hExo cells entered the cell cycle. Samples were labeled with EdU for 30 min before harvesting to identify S-phase cells. The y-axis shows the intensity of EDU staining and the x-axis shows the amount total DNA determined by DAPI. A small number of cells do not reenter S-phase after release from the double thymidine block (lower left corner of flow cytometry distribution). (B) Northern blot of histone mRNAs as cells exit the cell cycle. This was from a different experiment than A, and in each experiment there were slight differences in the rate of progression of S-phase, and in every experiment, WT and TUT7 KO cells were synchronized in parallel. The results of this northern blot were used to determine the sample used in panels C–E for analysis of histone mRNA degradation intermediates. Note that the histone mRNA levels decrease slightly later in the TUT7 KO than in the WT cells. (C–E) Histone mRNA degradation intermediates in the WT cells, TUT7 KO cells and 3′hExo KO cells during the time histone mRNAs were being degraded (6 h, 7 h, and 10 h, respectively) are shown. The data were plotted as in Figure 3.




