


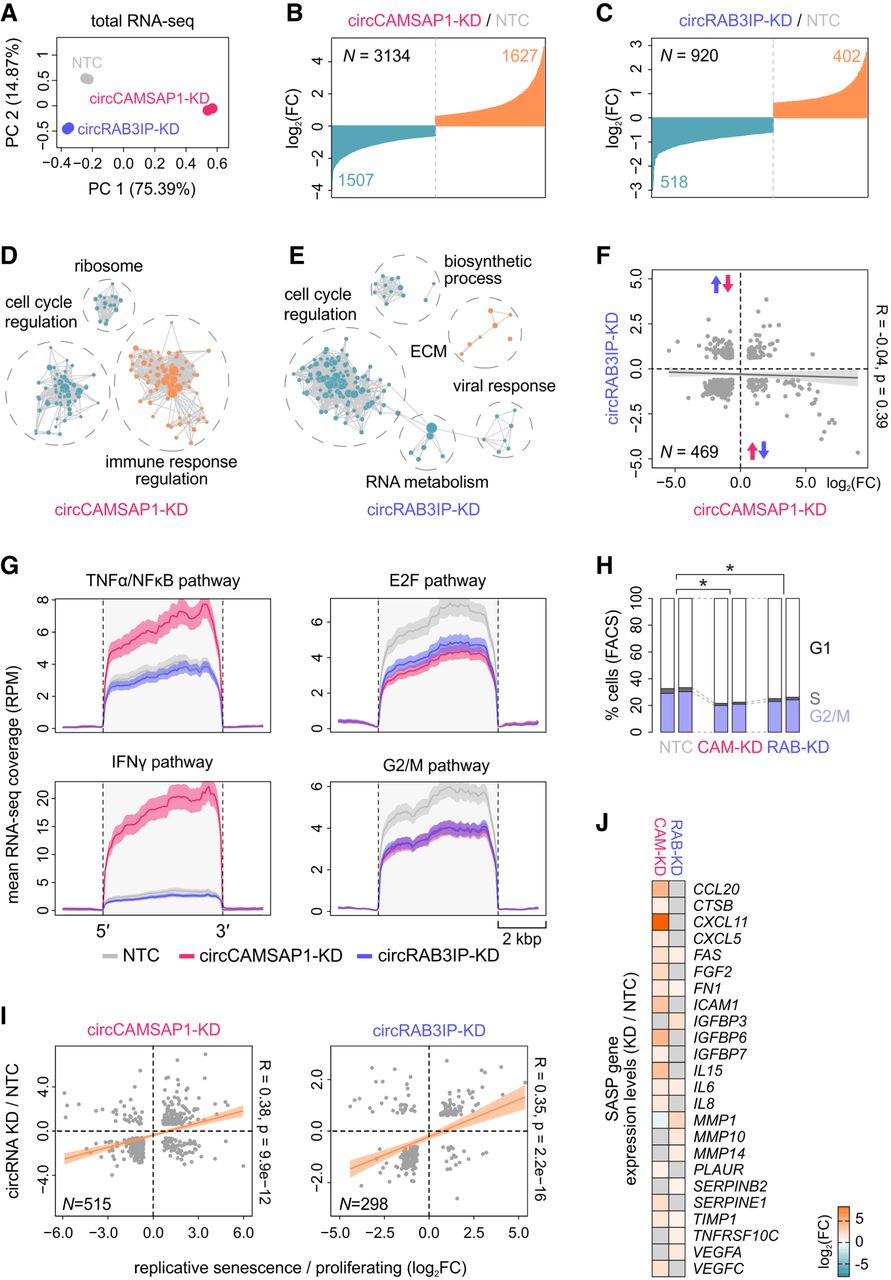
circCAMSAP1- and circRAB3IP-KD trigger major transcriptional changes in HUVECs. (A) PCA plot of RNA-seq replicates from circCAMSAP1- (magenta), circRAB3IP-KD (blue), and control HUVECs (NTC; gray). (B) Bar plot showing fold change (log2) for genes up-/down-regulated (orange/blue) in circCAMSAP1-KD data with a Padj ≤ 0.05 and absolute (log2) fold change ≥ 0.6. (C) As in panel B, but for circrRAB3IP-KD data. (D) Gene set enrichment analysis of DEGs from panel B. Related terms are clustered (dotted circles) and labeled by the group-dominant gene ontology. (E) As in panel D, but for circRAB3IP-KD DEGs. (F) Scatter plot correlating (log2) fold-change values for DEGs (N) shared by circCAMSAP1- and circRAB3IP-KD; Pearson's correlation coefficient (R) and its associated P-value are indicated. (G) Plots of circCAMSAP1- (pink) and circRAB3IP-KD (blue) mean normalized coverage across genes linked to inflammation and cell cycle control. NTC data coverage (gray) provides a baseline. (H) Bar plots depicting cell cycle profiles determined via FACS of PI-stained HUVECs in circRNA-KD experiments (two replicates). (*) Significantly different to NTC; P < 0.05, Fisher's exact test. (I) As in panel F, but correlating circRNA-KD DEGs with those from senescent HUVECs. (J) Heatmap of SASP genes that are also DEGs in circRNA-KD data. Color coding reflects (log2) fold-change values with a Padj ≤ 0.05.




