


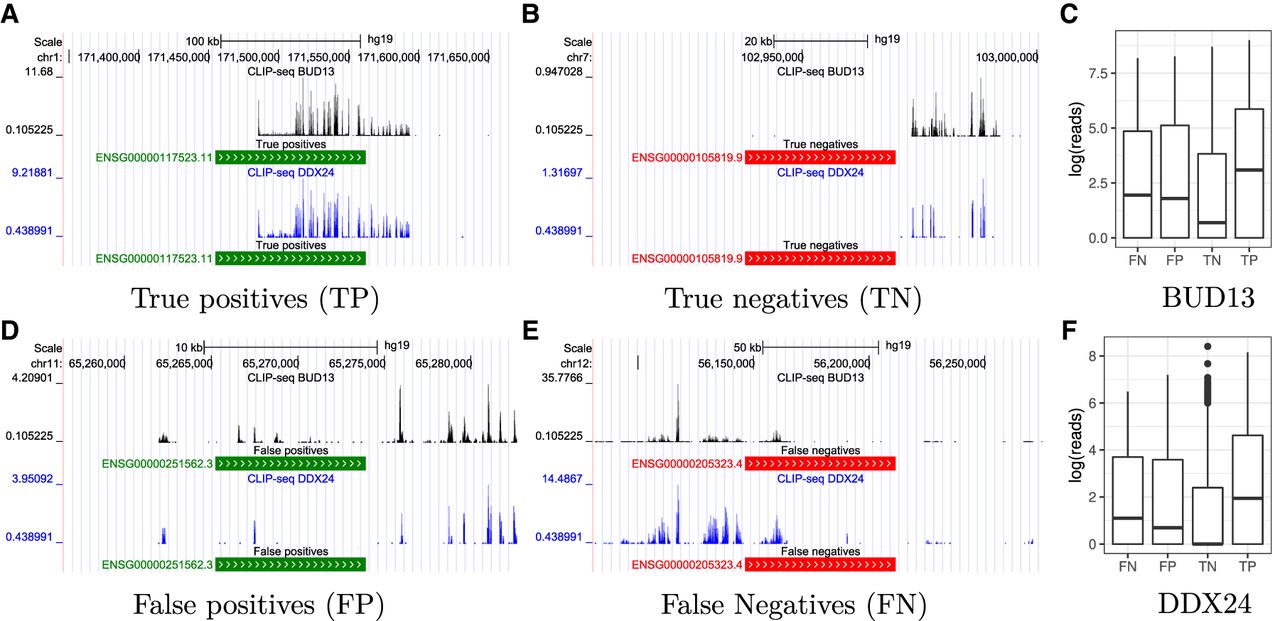
FIGURE 4.
The plots show representative genome tracks produced using the eCLIP data annotated by predictions made by our model under four different outcomes: true positives in A, true negatives in B, false positives in D, and false negatives in E. We consider two proteins, BUD13 and DDX24, in the inductive link prediction task for the K562 cell line. Positive predictions are shown in green and negative predictions in red. We also plot the distribution of reads (Fig. 4C,F) for the two proteins under the four outcomes.




