


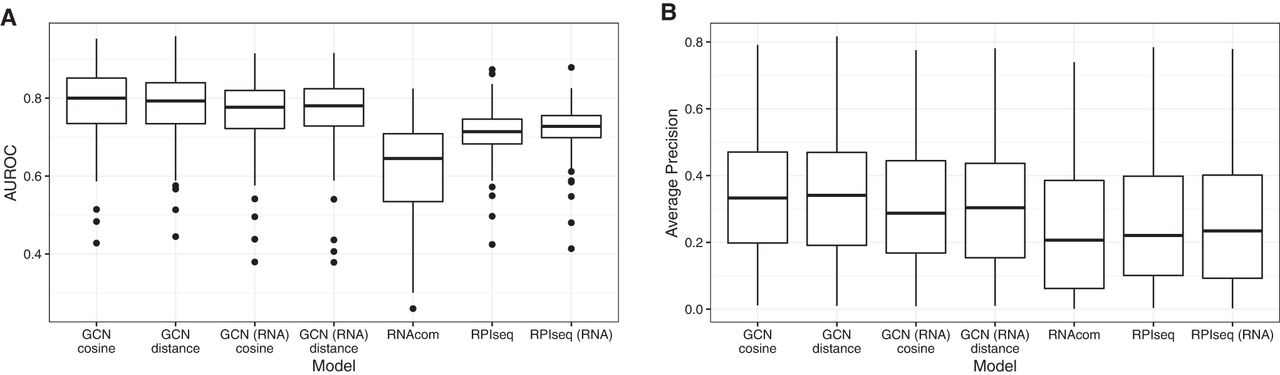
FIGURE 3.
Comparing the performance of various models for de novo prediction in K562 cell line. Each box shows the distribution of mean AUROC (A) or average precision (B) over the entire set of proteins when the model is tested for a single protein in the test set.




