


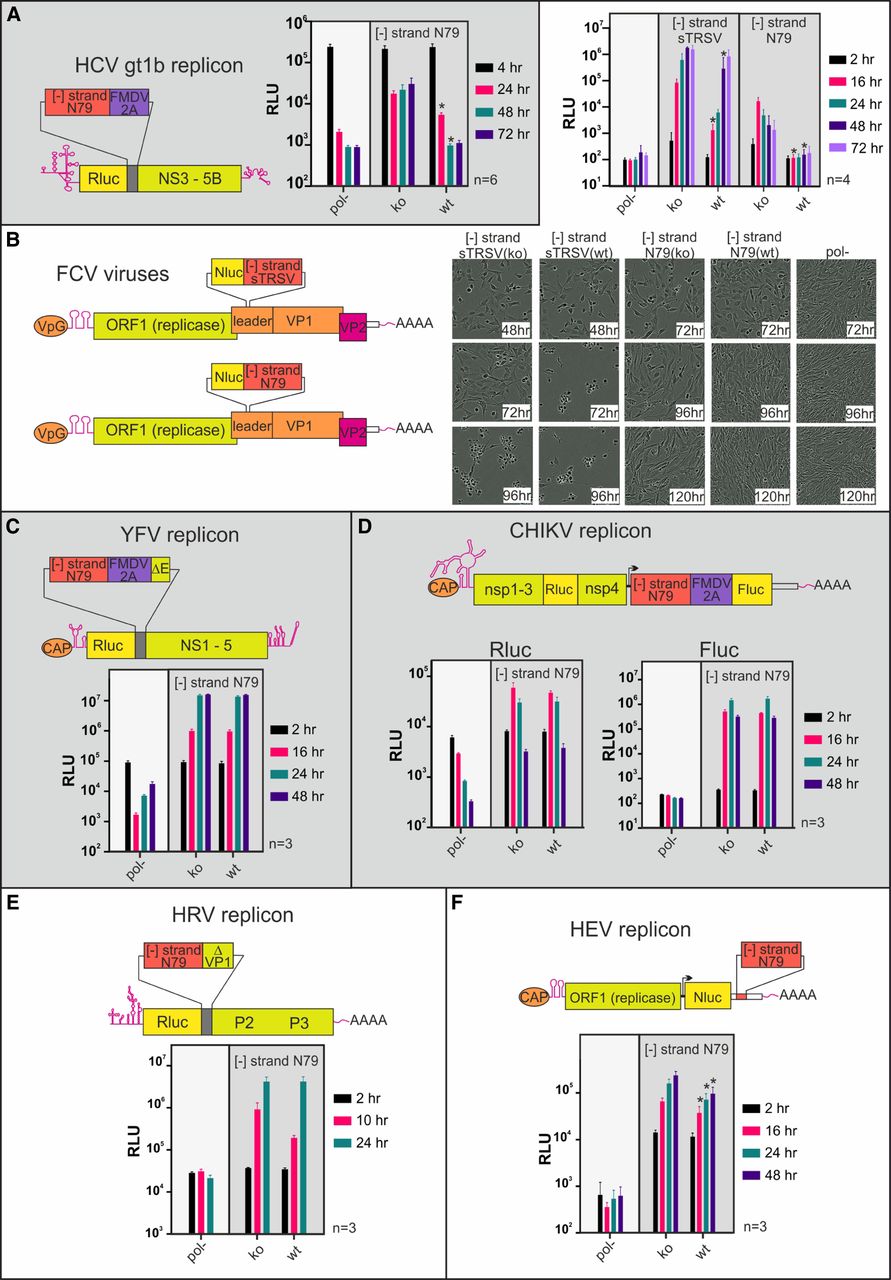
Embedding Rbzs in the [−] RNA of a diverse set of positive strand RNA virus constructs results in different replicative outcomes. A schematic depiction showing the positioning of the reverse complemented N79 Rbz or sTRSV Rbz sequence is provided for an (A) HCV gt1b replicon, (B) FCV virus, (C) YFV replicon, (D) CHIKV replicon, (E) HRV replicon, and (F) HEV replicon. The regions ΔE and ΔVP1 in the YFV and HRV schematics represent the carboxy-terminal ends of the E protein and VP1 protein, needed for proteolytic processing at the amino terminus of the NS1 and P2 boundaries, respectively. Also shown are luciferase replication data from those same isolates, and in the case of the FCV virus experiments representative images illustrating differences in cpe development over time. The number of experimental repeats for each luciferase assay is indicated next to the respective graph. Significant differences between inactive (ko) and active (wt) Rbz constructs are highlighted ([*] P < 0.05; paired t-test).




