


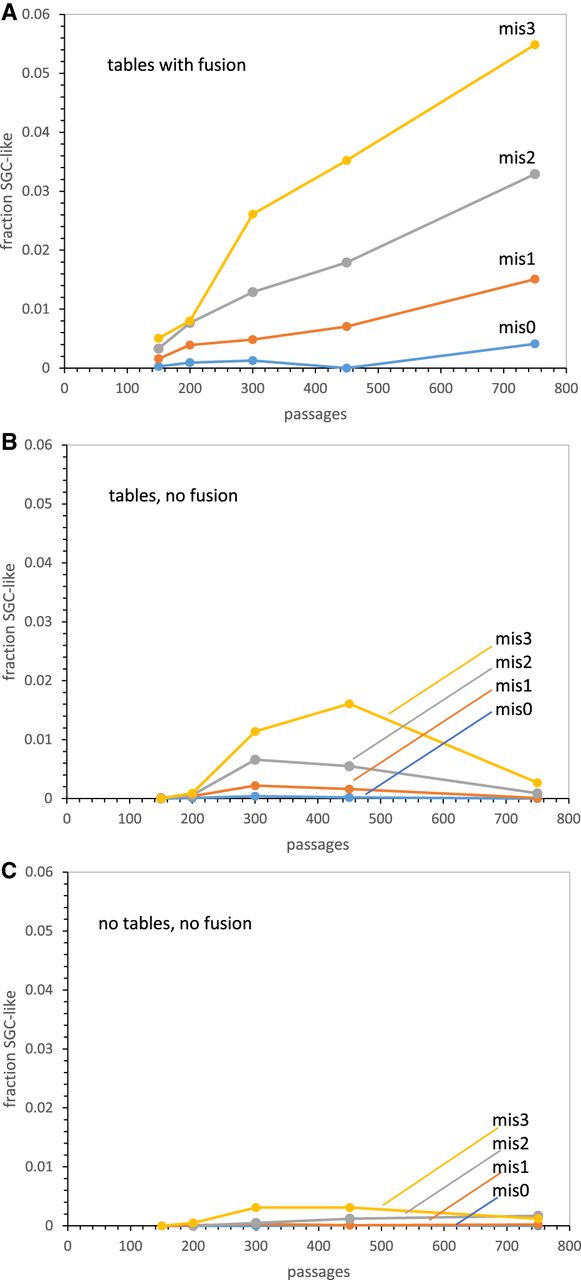
(A) SGC-like codes versus time: tables and fusion. The fraction of almost complete codes (≥20 functions) with cited levels of misassignment (relative to the SGC) is plotted for 10,000 environments that have both new code initiation and fusion. mis0 = no misassignments/mis1 = 1 misassignment, and so on. Ten thousand environments evolved to the times/passages shown, and codes with ≥20 assigned functions were characterized. Pmut = 0.00975, Pdecay = 0.00975, Pinit = 0.150, Prand = 0.050, Pfus = 0.002, Ptab = 0.08. (B) SGC-like codes vs time: tables, no fusion. The fraction of almost complete codes with cited levels of misassignment (relative to the SGC) is plotted for 10,000 environments that have new code initiation, but no fusion. mis0 = no misassignments/mis1 = 1 misassignment, and so on. Ten thousand environments evolved to the times/passages shown, and codes with ≥20 assigned functions were characterized. Pmut = 0.00975, Pdecay = 0.00975, Pinit = 0.150, Prand = 0.050, Pfus = 0.000, Ptab = 0.08. (C) SGC-like codes vs time: no new tables, no fusion. The fraction of almost complete codes with cited levels of misassignment (relative to the SGC) is plotted for 10,000 environments that have no new code initiation, and no fusion. mis0 = no misassignments/mis1 = 1 misassignment, and so on. Ten thousand environments with single tables evolved to the times/passages shown, and codes with ≥20 assigned functions were characterized. Pmut = 0.00975, Pdecay = 0.00975, Pinit = 0.150, Prand = 0.050, Pfus = 0.000, Ptab = 0.00.




