


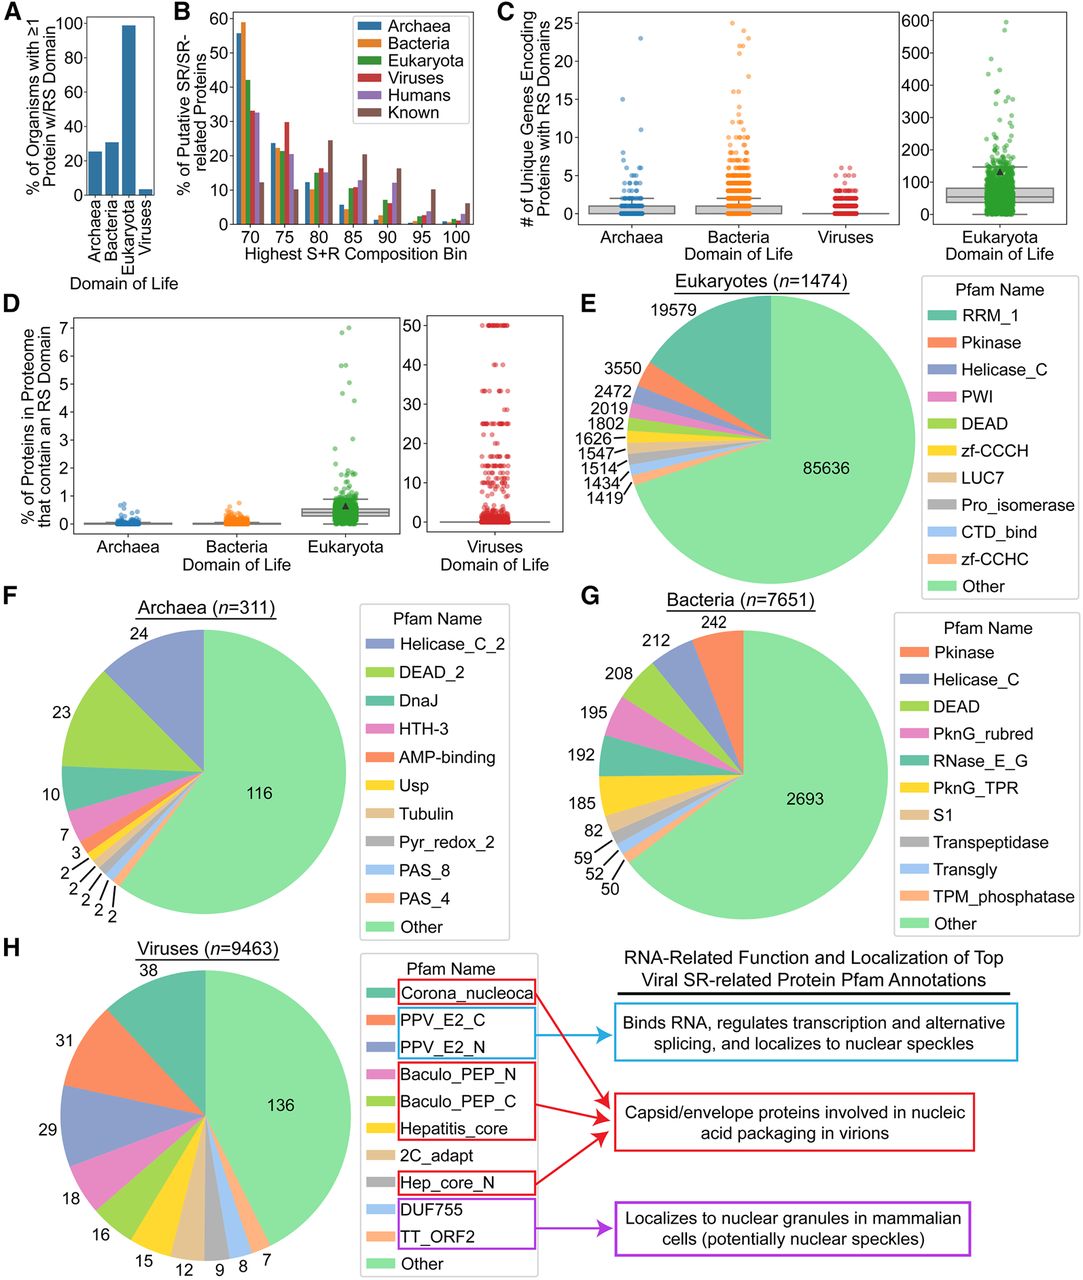
Frequencies of SR/SR-related proteins and Pfam annotations across four domains of life. (A) The percentage of proteomes from each domain of life containing at least one SR/SR-related protein. (B) The percentage of SR/SR-related proteins (y-axis) from each domain of life achieving each maximum S + R composition within a 20-residue scanning window (x-axis). (C) For each organism, the total number of SR proteins was calculated and plotted. The black triangle on the Eukaryota plot represents the number of unique proteins in the human proteome (excluding isoforms). (D) The percentage of proteins containing an RS domain among all organisms with at least one SR/SR-related protein. The top 10 most common Pfam annotations and their frequencies are indicated for eukaryotes (E), archaea (F), bacteria (G), and viruses (H). Parenthetical values in B–E indicate the total number of organisms analyzed.




