


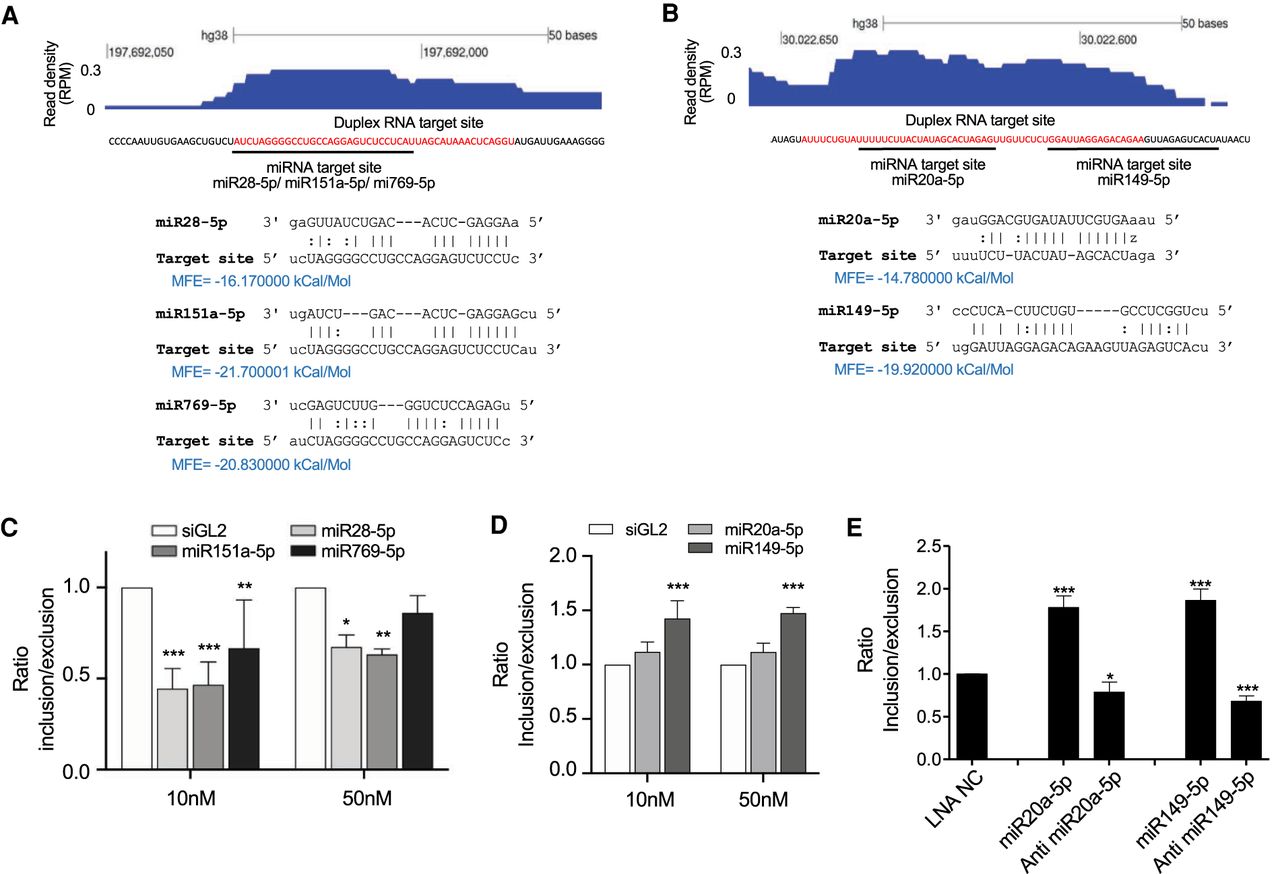
miRNA mimics induce splicing changes in RUBCN and FKBP14. (A) AGO2 protein binding cluster within RUBCN intronic RNA and potential binding sites for miRNAs. (B) AGO2 cluster within FKBP14 intronic RNA and potential binding sites for miRNAs. Red colored sequence defines the AGO2 clusters identified from eCLIP-seq. (C,D) qPCR quantification of splicing changes after one cay by miRNA mimics in (C) RUBCN and (D) FKBP14. (E) qPCR quantification of splicing changes after four cays by anti-miR LNAs or miRNA mimics within FKBP14. Error bars represent standard deviation (SD). (*) P < 0.05; (**) P < 0.01; (***) P < 0.001 compared with WT by one-way ANOVA and Dunnett's multiple comparisons test. siGL2 is negative control siRNA. LNA-NC is a negative control ASO. (MFE) Minimum free energy. Experiments with miRNA mimics required a 1 d incubation with the synthetic nucleic acid; experiments with anti-miRs required 4 d.




