


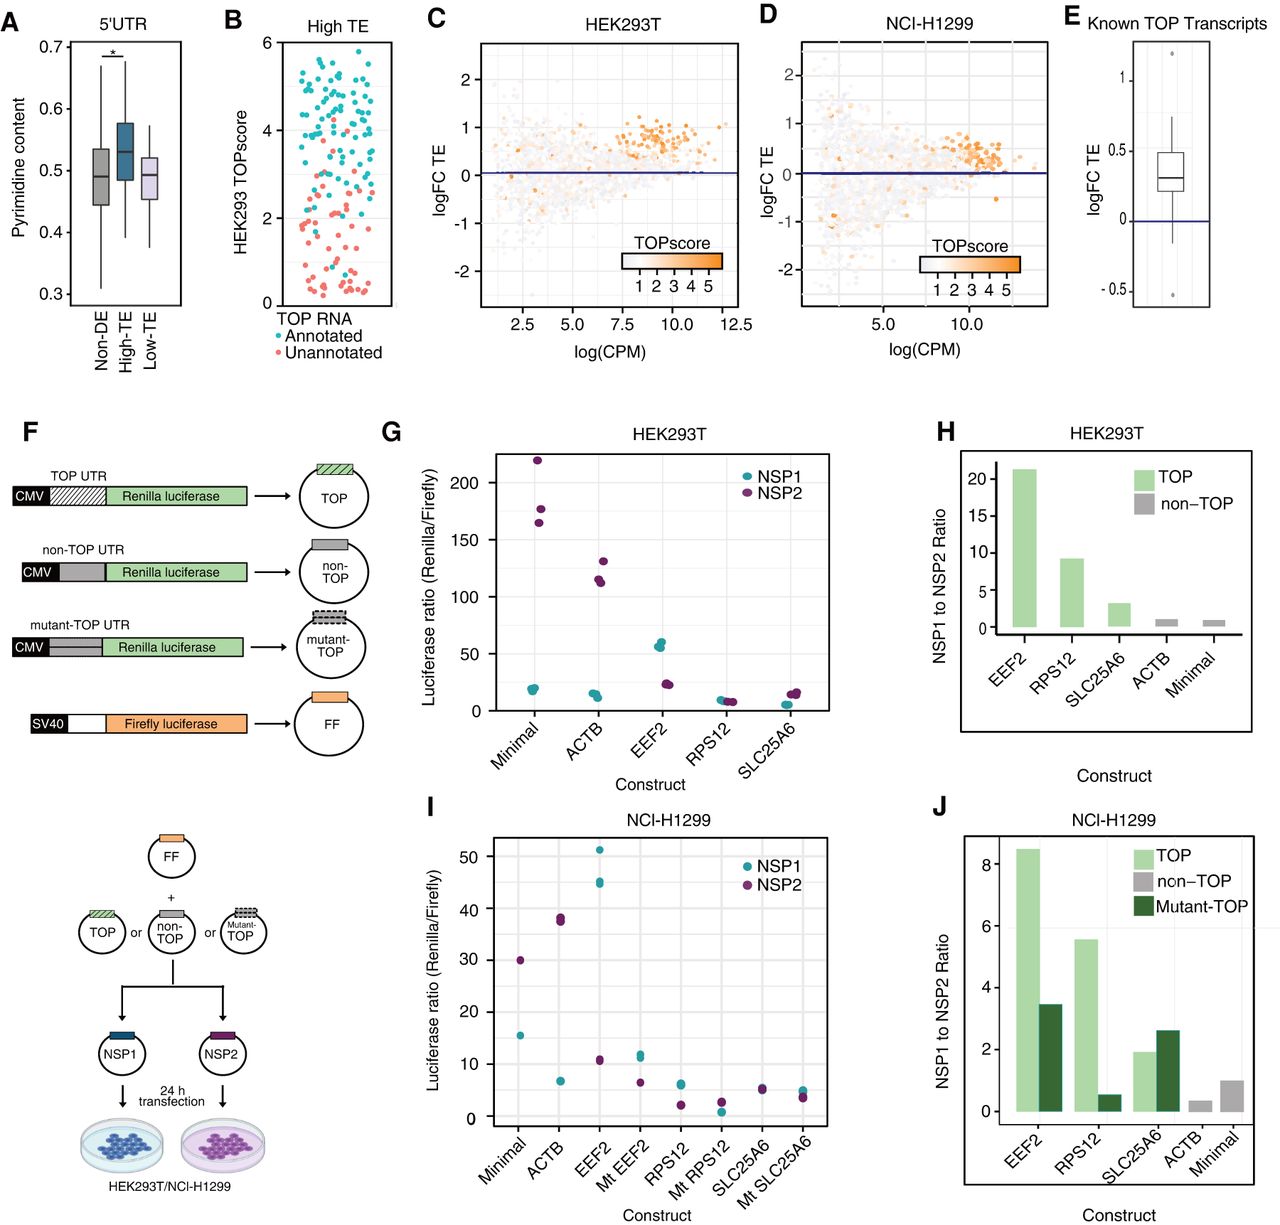
5′ terminal oligopyrimidine tracts in the 5′ UTRs of genes with preferential translation efficiency. (A) Pyrimidine content in the 5′ UTR for high translation efficiency (high-TE), low translation efficiency (low-TE), and nondifferentially expressed (non-DE) control genes. Outliers were not shown. Asterisk demarcates comparisons with significant Dunn's post-hoc tests at a P-value cutoff of 0.01. (B) TOPscores for all genes in the high-TE set retrieved from Philippe et al. 2020. Blue and pink dots represent previously annotated or unannotated 5′TOP RNAs, respectively. (C) Log2 fold-change of translation efficiency comparing Nsp1 and Nsp2 in HEK293T and (D) NCl-H1299 expressing cells as determined by matched ribosome profiling and RNA-seq (see Materials and Methods). Each gene is colored according to its TOPscore (Philippe et al. 2020) (E) Box plot showing the log2 fold-change of translation efficiency of known TOP transcripts as determined by matched ribosome profiling and RNA-seq from NCl-H1299 cell line. (F) Schematic representation of the luciferase reporter assay. (G) The ratio of Renilla to Firefly luciferase activity in HEK293T cells are plotted for five constructs. 5′UTRs from the unmodified reporter (minimal), a non-TOP transcript (ACTB), or three TOP transcripts (EEF2, RPS12, and SLC25A6) were analyzed in presence of Nsp1 and Nsp2. (H) The mean ratio of the luciferase values from HEK293T cells (corresponding to the previous panel) normalized to the ratio of minimal construct are plotted for comparison. (I) The ratio of Renilla luciferase to Firefly luciferase activity in NCl-H1299 cells are plotted for three TOP constructs (EEF2, RPS12, and SLC25A6) along with their corresponding mutants (Mt) wherein the purines in the TOP motif were replaced with pyrimidines and non-TOP constructs (ACTB, minimal vector). (J) The mean of the ratio of luciferase values for both TOP, mutant-TOP, and non-TOP constructs normalized to the ratio of minimal construct from NCl-H1299 cells are plotted for comparison.




