


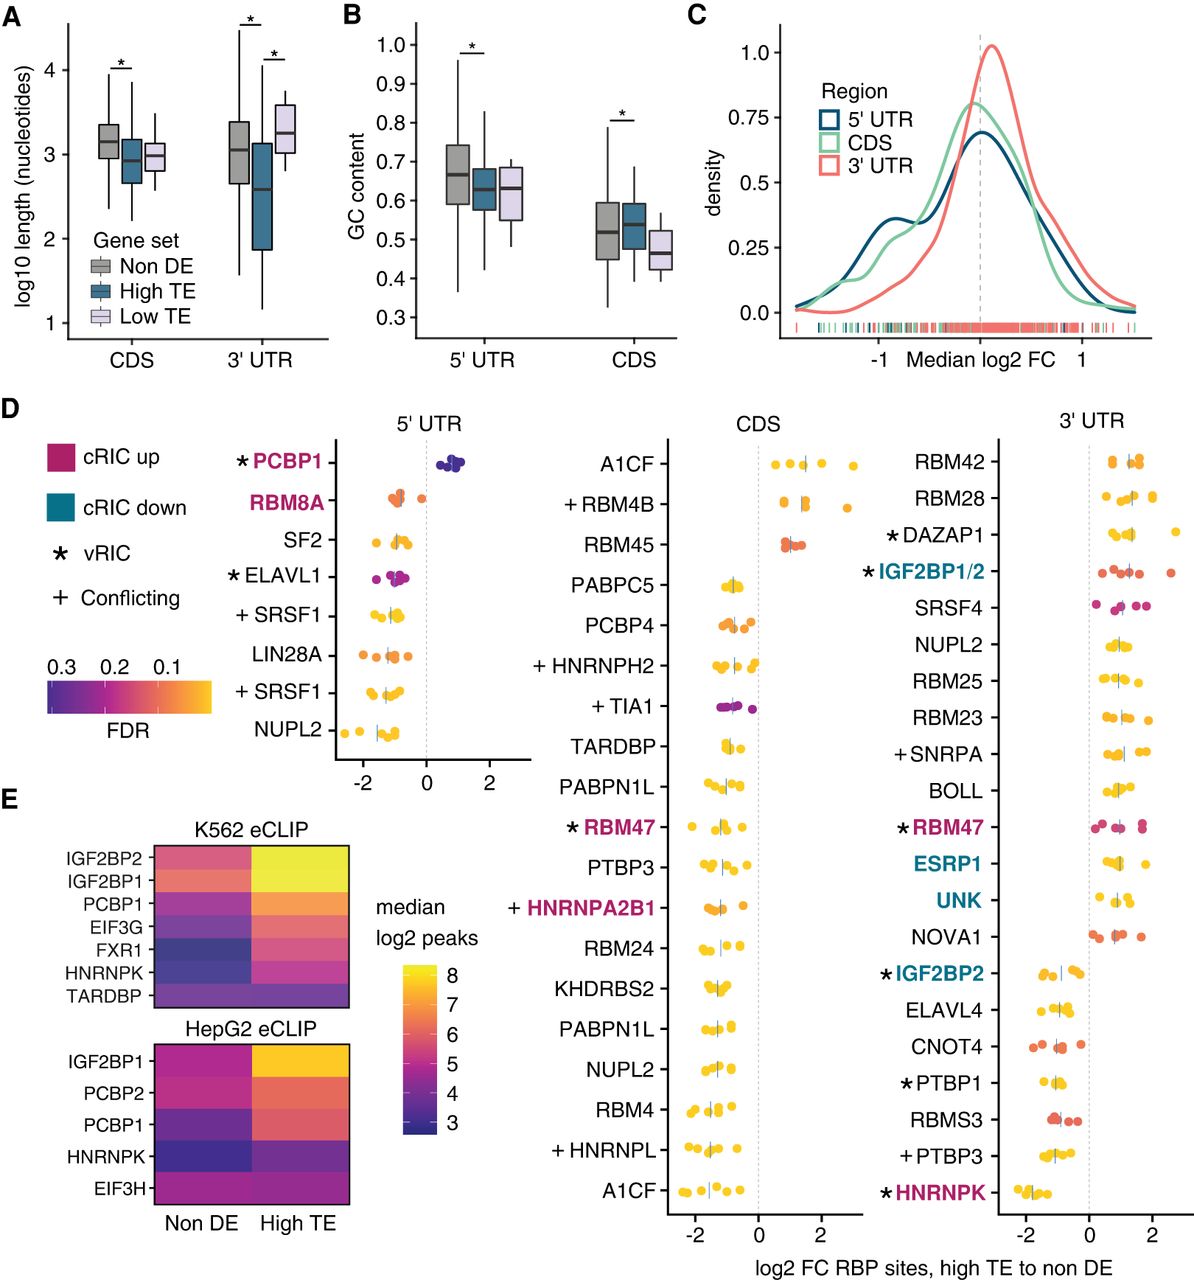
Sequence features and RNA binding protein analysis. (A) Lengths of coding sequence (CDS) and 3′ untranslated region (3′-UTR) for high translation efficiency (high-TE), low translation efficiency (low-TE), and nondifferentially expressed (non-DE) control genes. Outliers greater than (1.5× interquartile range) were omitted for clarity. Asterisks indicate significant Kruskal–Wallis and Dunn's post-hoc tests at a significance level of 0.01. (B) 5′ untranslated region (5′ UTR) and CDS GC content of gene sets. Outlier removal, statistical tests, and significance level were applied as in A. (C) Distribution of the median log2 fold changes (FC) in RBP sites between high-TE and non-DE gene sets. Across the x-axis, kernel density estimation of the median log2 FCs across six non-DE gene sets for each RBP site in the oRNAment database (Benoit Bouvrette et al. 2020). (D) Differential RBP site analysis for high-TE to matched non-DE gene sets for oRNAment database RBPs. RBP sites with median log2(FC) > 0.8 are shown. Heat scale corresponds to the false discovery rate for Fisher's exact tests. Each point corresponds to an independent comparison with a non-DE control set. Blue lines mark the median. Numerous filters were applied and some RBPs are shown twice if more than one of its motif position weight matrices was differential. cRIC = Comparative RNA interactome capture. vRIC = Viral RNA interactome capture (Kamel et al. 2020). “Conflicting” indicates discrepancy in hit on viral RNA between vRIC and ChIRP-MS (Flynn et al. 2020). (E) Enhanced crosslinking-immunoprecipitation (eCLIP) peaks (Van Nostrand et al. 2020) for selected RBPs in the high-TE versus non-DE sets in uninfected cells. Heat scale shows the median of the log2 reproducible peaks found in exonic regions of each gene set in K562 and HepG2 cells.




