


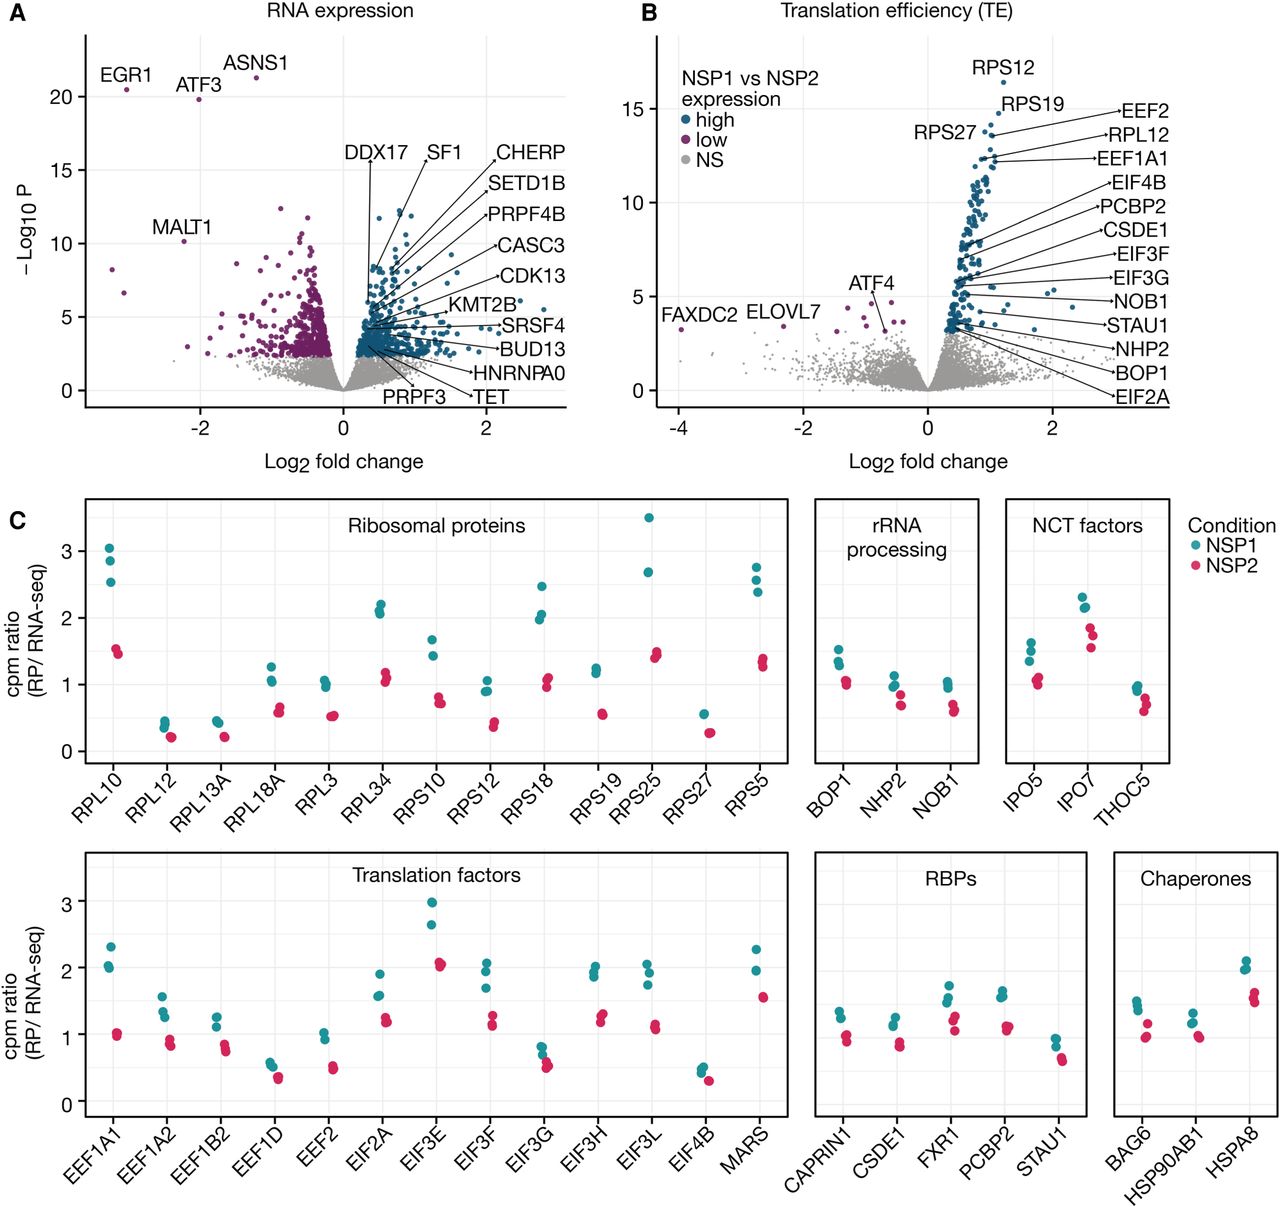
Differential RNA expression and translation efficiencies upon Nsp1 expression. (A) Volcano plot depicting RNA expression changes in HEK293T cells expressing Nsp1 as compared to a control viral protein (Nsp2). Representative genes belonging to functional groups of proteins with enriched differential RNA expression are highlighted. Nonsignificant genes are shown in gray. (B) Volcano plot depicting translation efficiency (TE) changes in HEK293T cells expressing Nsp1 as compared to a control viral protein (Nsp2). Ribosome occupancy differences normalized by RNA expression changes (differential TE) were calculated from the same samples (see Materials and Methods). Highlighted genes belong to highly enriched groups of functionally related genes. (C) Counts per million reads (cpm) from ribosome profiling (RP) or RNA-seq experiments were calculated for each of the highlighted genes. The ratio of cpm values from matched ribosome profiling and RNA-seq experiments were plotted for each of the three replicates. Selected genes from the following categories are highlighted: ribosomal proteins, genes involved in rRNA processing, genes involved in nucleocytoplasmic transport (NCT), translation factors, RNA binding proteins (RBPs), and chaperones.




