


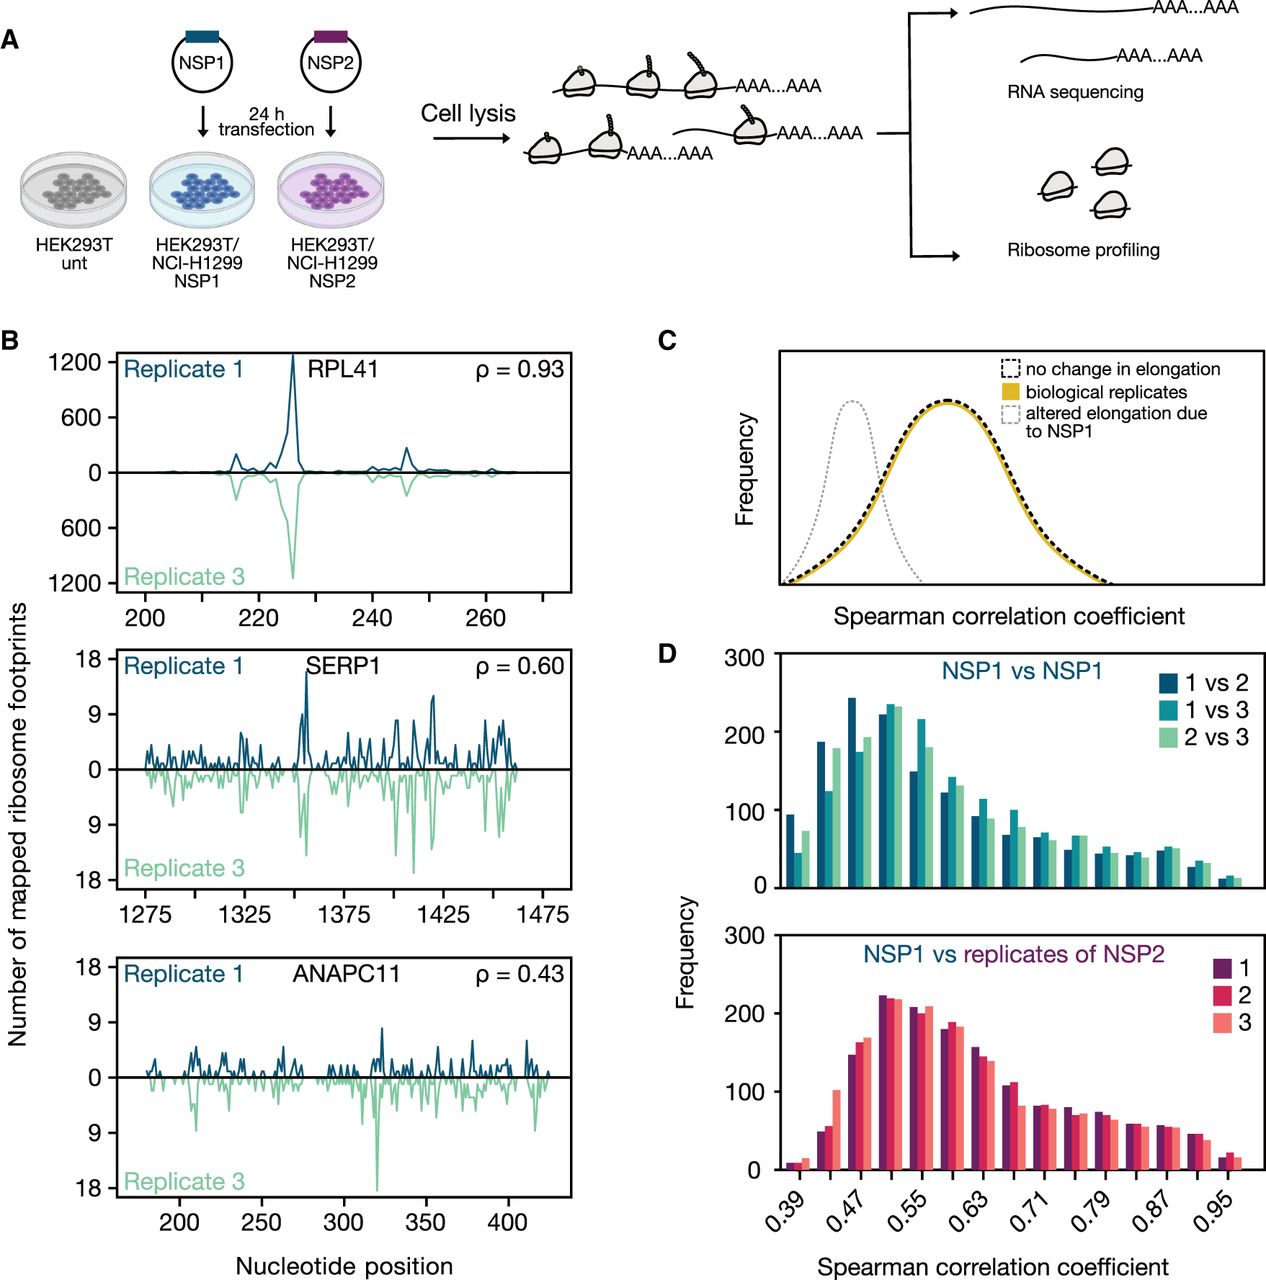
Ribosome occupancy at nucleotide resolution. (A) Schematic showing the experimental design for RNA-seq and ribosome profiling experiments. (B) Example genes with varying degrees of similarity of nucleotide resolution ribosome distribution among replicates were shown along with their Spearman correlation coefficients. (C) The distribution of Spearman correlation coefficients of nucleotide-resolution ribosome footprint counts can be used to differentiate the following two hypotheses. Yellow line indicates the distribution of correlation coefficients between biological replicates of a given treatment. If translation elongation is impaired globally in NSP1-expressing cells, we would expect the distribution to shift toward lower values when comparing ribosome distribution of NSP1- to NSP2-expressing cells (gray dashed line). In contrast, the distribution will be similar to that of biological replicates in case of no effect (black dashed line). (D) Ribosome distributions at nucleotide resolution for 1501 genes (see Materials and Methods) were used to calculate Spearman correlation coefficients between pairs of Nsp1 replicate experiments (top) or between an NSP1 replicate and NSP2 experiments (bottom). The histogram depicts the distribution of correlation coefficients across all analyzed genes.




