


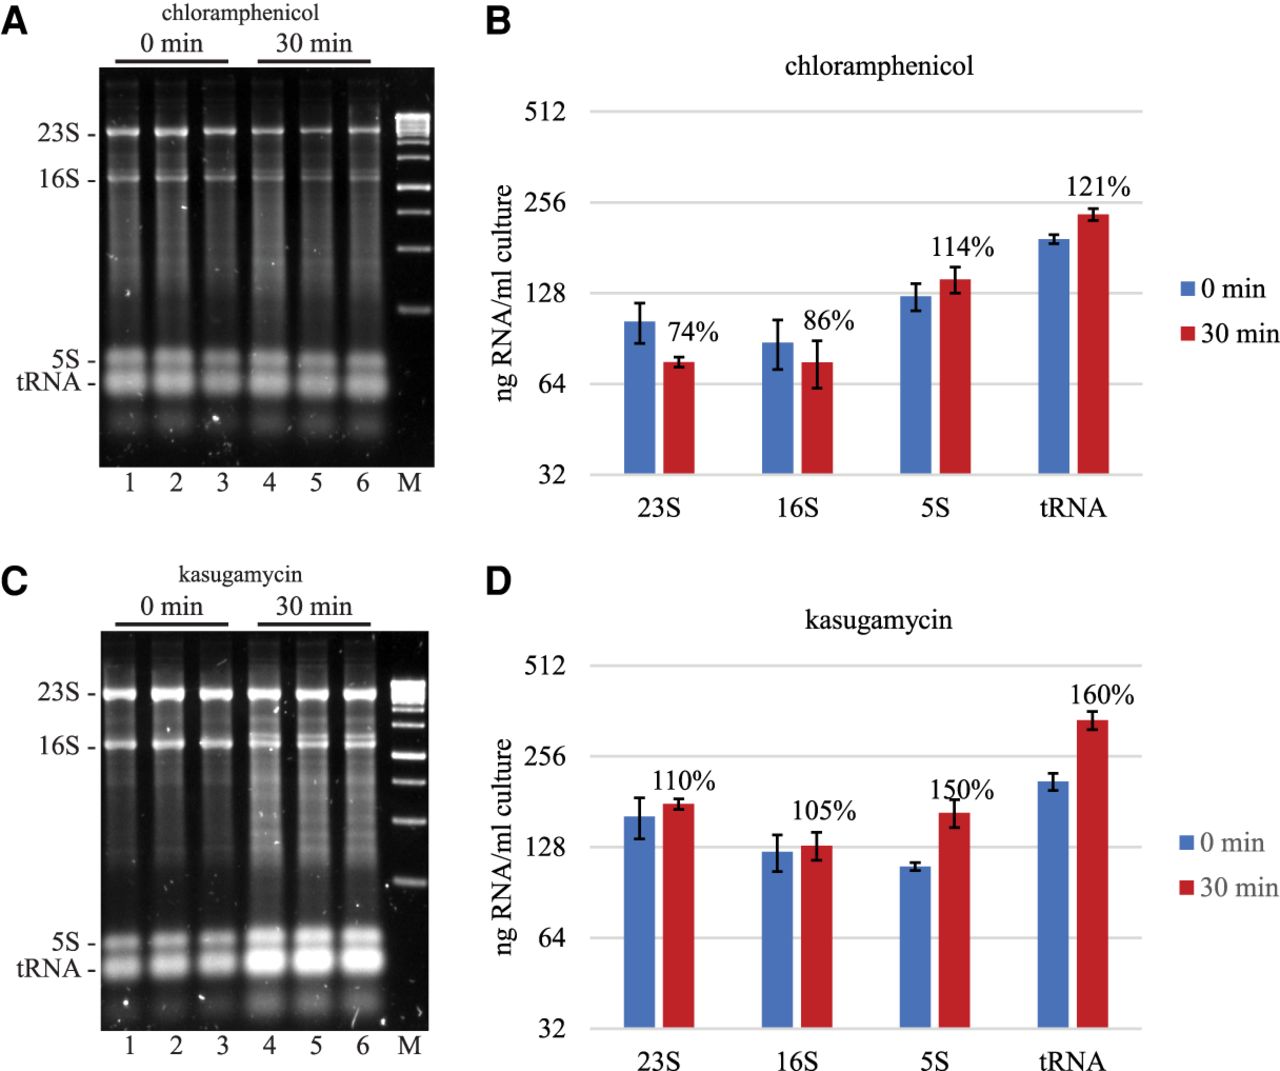
Effect of protein synthesis inhibitors on rRNA and tRNA levels. Total RNA extracted from equal volumes of culture was separated by agarose gel electrophoresis. The gels were imaged by SYBR Safe staining. M = DNA size markers. (A,C) NCM3416 grown in LB medium at 37°C was treated with chloramphenicol (125 µg/mL) or kasugamycin (1 mg/mL). The 0 min time points were taken immediately after addition of antibiotic. Lanes 1–3 are biological replicates; lanes 4–6, the corresponding 30 min time points. (B,D) Quantification of 23S, 16S, 5S rRNA, and tRNA levels showing the average and standard deviation from six biological replicates. Percentages represent normalization to the 0 min time point.




